- Home
- /
- SAS Viya
- /
- Visual Analytics
- /
- Re: Multiple line graph in VA, category values as lines
- RSS Feed
- Mark Topic as New
- Mark Topic as Read
- Float this Topic for Current User
- Bookmark
- Subscribe
- Mute
- Printer Friendly Page
- Mark as New
- Bookmark
- Subscribe
- Mute
- RSS Feed
- Permalink
- Report Inappropriate Content
I have a simple question to which I haven't found an answer. I have small data, that I want to display with a line graph.
Data has 3 columns and just few lines
data structure:
selection (category), year (category), measureA (measure)
A 2000 1
A 2001 2
A 2002 3
B 2000 3
B 2001 2
B 2002 1
C 2000 2
C 2001 3
C 2002 1
So I want to display year on X-axis and 3 lines (selection A, B and C) and their measures on Y-axis. How to do this? VA version 7.3.
Accepted Solutions
- Mark as New
- Bookmark
- Subscribe
- Mute
- RSS Feed
- Permalink
- Report Inappropriate Content
Hi J_,
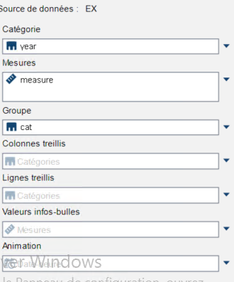
U can add display group in a line graph.
These feature allow you to create many lines.
Regards,
GM.
- Mark as New
- Bookmark
- Subscribe
- Mute
- RSS Feed
- Permalink
- Report Inappropriate Content
Hi J_,
U can add display group in a line graph.
These feature allow you to create many lines.
Regards,
GM.
See how to use one filter for multiple data sources by mapping your data from SAS’ Alexandria McCall.
Find more tutorials on the SAS Users YouTube channel.


