- Home
- /
- SAS Viya
- /
- Visual Analytics
- /
- Monitoring LASR Memory
- RSS Feed
- Mark Topic as New
- Mark Topic as Read
- Float this Topic for Current User
- Bookmark
- Subscribe
- Mute
- Printer Friendly Page
- Mark as New
- Bookmark
- Subscribe
- Mute
- RSS Feed
- Permalink
- Report Inappropriate Content
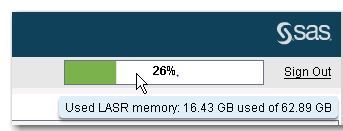
Hi I am trying to turn-on the "Used LASR Memory" graph in the upper right of the SAS VA. How do I do that?
Thank you.
- Mark as New
- Bookmark
- Subscribe
- Mute
- RSS Feed
- Permalink
- Report Inappropriate Content
The memory gauge is available in SAS Visual Analytics administrator in the main menu bar if you are using a distributed VA configuration. See http://support.sas.com/documentation/cdl/en/vaag/69958/HTML/default/viewer.htm#p12krtemxr8tfmn1ksebw...
Kind Regards,
Michelle
- Mark as New
- Bookmark
- Subscribe
- Mute
- RSS Feed
- Permalink
- Report Inappropriate Content
Hi Michelle,
Thank you your reply. Yes we are using a distributed configuration. However the memory gauge has disappeared suddenly by itself and we would like to turn it back on. How do we place it back on the main menu bar?
Thank you.
Regards
Cathy
- Mark as New
- Bookmark
- Subscribe
- Mute
- RSS Feed
- Permalink
- Report Inappropriate Content
Hi Cathy,
For the gauge to suddenly disappear is certainly strange. Are you able to see the memory resource utilization from the LASR -> Monitor Resources menu option?
The link to the documentation I provided above states "The gauge provides information for only the distributed server that is referenced in the service.properties file in the SAS configuration directory (at /Applications/SASVisualAnalytics/HighPerformanceConfiguration)." Has there been a change to the configuration of the distributed server?
Anything in the log files to indicate a failure to render the gauge?
Might be worthwhile raising it with SAS tech support too. Please post back the outcome.
Cheers,
Michelle
- Mark as New
- Bookmark
- Subscribe
- Mute
- RSS Feed
- Permalink
- Report Inappropriate Content
Make sure that /<SASConfig>/Lev<X>/Applications/SASVisualAnalytics/HighPerformanceConfiguration/LASRMonitor.sh is up and running.
- Mark as New
- Bookmark
- Subscribe
- Mute
- RSS Feed
- Permalink
- Report Inappropriate Content
Have start up the LASR Monitor. However now we receive this error message - "An error occurred when the Resource Monitor tried to contact the SAS LASR Analytic Server Monitor. Please contact your system administrator".
Have I missed a step in between start/stop the server previously?
- Mark as New
- Bookmark
- Subscribe
- Mute
- RSS Feed
- Permalink
- Report Inappropriate Content
Since it's almost a year old, hopefully you've resolved this issue, but I wanted to mention that we had a similar issue where the Process Monitor and Resource Monitor in the the VA Administrator would not load and generated the same error message that you had seen.
After a little more than a month going back and forth with SAS Tech Support, our SAS Admin team has finally resolved the issue, and those Monitors now load as before. We are on SAS 9.4m3 and VA 7.3, so the root cause may be different for you.
Our VA App Server (and our BI App Server) had two versions of the sas.grid.broker installed:
/opt/sas/SASHome/SASVersionedJarRepository/eclipse/plugins/sas.grid.broker_703000.0.0.20150403143723_d4vaar9/sas.grid.broker.jar
/opt/sas/SASHome/SASVersionedJarRepository/eclipse/plugins/sas.grid.broker_703008.0.0.20170505155215_f0vaar9p/sas.grid.broker.jar
The value for sas.grid.broker in the picklist files was pointing at the newer "703008" version; after switching that to the older "70300" version and restarting the environment, the Monitors were back online.
If you haven't resolved your issue, and you need more details, let me know. If you have resolved your issue, and it was by some other means, please also let me know.
David
- Mark as New
- Bookmark
- Subscribe
- Mute
- RSS Feed
- Permalink
- Report Inappropriate Content
- Mark as New
- Bookmark
- Subscribe
- Mute
- RSS Feed
- Permalink
- Report Inappropriate Content
Alex,
Yes, thank you!
I sent a follow-up to the Track with a curious thing, though. The "other" Jar file location is listed in the picklist files in our Test environment, and the Monitors load just fine.
Thanks again for all your help!
David
- Mark as New
- Bookmark
- Subscribe
- Mute
- RSS Feed
- Permalink
- Report Inappropriate Content
Hi @DavidRice I just checked the two files you listed below. I am also using the same versions as you do. And we only have the
/opt/sas/SASHome/SASVersionedJarRepository/eclipse/plugins/sas.grid.broker_703000.0.0.20150403143723_d4vaar9/sas.grid.broker.jar installed.
Seems like I am missing another sas.grid.broker.jar file....?
c4th1
- Mark as New
- Bookmark
- Subscribe
- Mute
- RSS Feed
- Permalink
- Report Inappropriate Content
Hello David,
We also have the same of SAS and SAS VA.
Could you please give me the detailed step of all the checks you had to do and the final solution given by SAS Tech Support ?
looks like my root cause is going to be different that yours .
I have only one directory @ /opt/sas/SASHome/SASVersionedJarRepository/eclipse/plugins/ which is
> sas.grid.broker_703000.0.0.20150403143723_d4vaar9
thanks in anticipation.
Cheers,
Ritesh
Catch up on SAS Innovate 2026
Dive into keynotes, announcements and breakthroughs on demand.
Explore Now →See how to use one filter for multiple data sources by mapping your data from SAS’ Alexandria McCall.
Find more tutorials on the SAS Users YouTube channel.


