- Home
- /
- SAS Viya
- /
- Visual Analytics
- /
- Mid range values
- RSS Feed
- Mark Topic as New
- Mark Topic as Read
- Float this Topic for Current User
- Bookmark
- Subscribe
- Mute
- Printer Friendly Page
- Mark as New
- Bookmark
- Subscribe
- Mute
- RSS Feed
- Permalink
- Report Inappropriate Content
Hi,
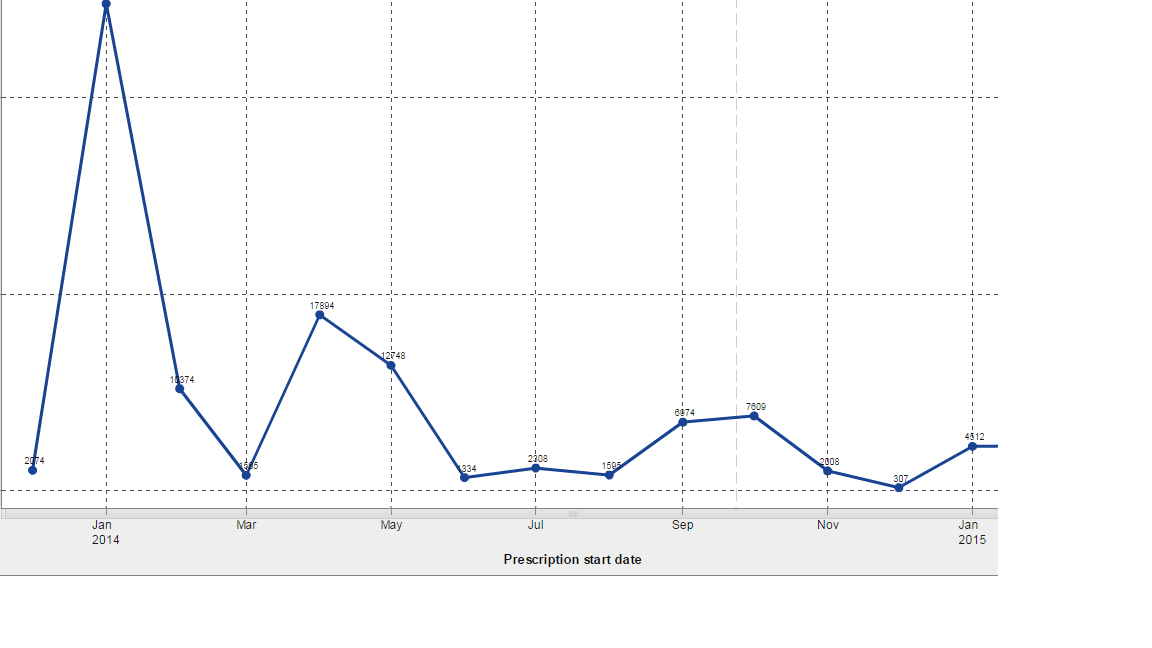
in the report, we would like to show all the months starting from a particular start date. How ever, when using the line chart, I could see only some of the months. Is there a way to show all the months of the year.

Here February, April and so on is not shown. How to display all the months.
Thanks.
Kind regards,
Ajay
- Mark as New
- Bookmark
- Subscribe
- Mute
- RSS Feed
- Permalink
- Report Inappropriate Content
Hi Vasireddy,
As per your above example you are using Time Series Plot object.
You can show all by building custom graph. if you want steps for building custom graph i will send but i don't think it will work.
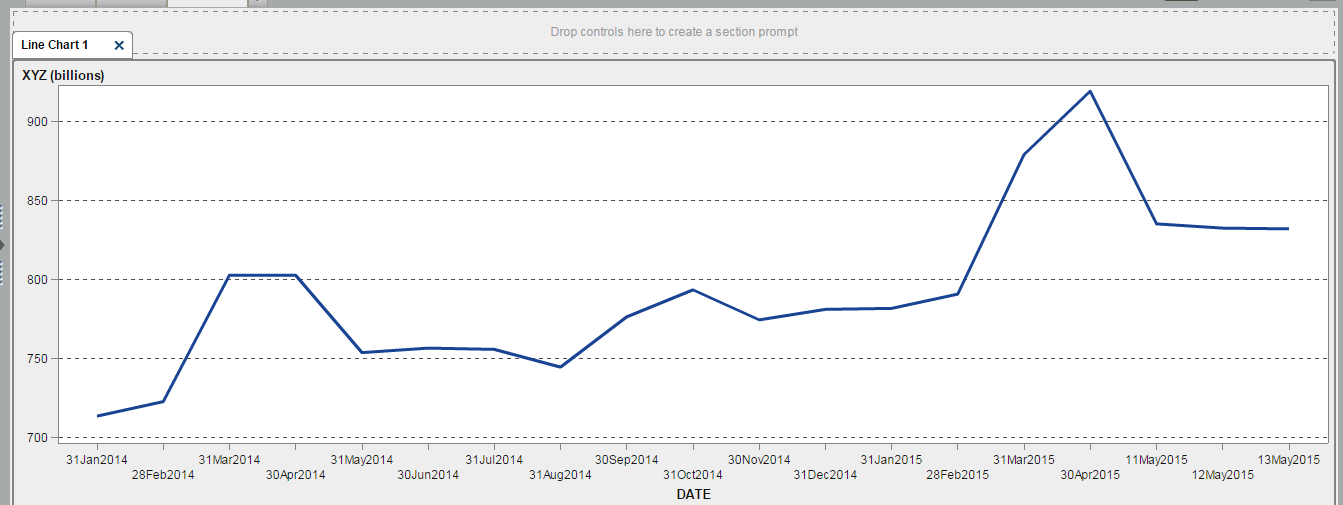
Instead of this you can use line chart.
Here is the Line chart Example,

Thanks & Regards,
Teja Surapaneni.
April 27 – 30 | Gaylord Texan | Grapevine, Texas
Registration is open
Walk in ready to learn. Walk out ready to deliver. This is the data and AI conference you can't afford to miss.
Register now and save with the early bird rate—just $795!
See how to use one filter for multiple data sources by mapping your data from SAS’ Alexandria McCall.
Find more tutorials on the SAS Users YouTube channel.


