- Home
- /
- SAS Viya
- /
- Visual Analytics
- /
- Re: Incorrect aggregation of ABS values
- RSS Feed
- Mark Topic as New
- Mark Topic as Read
- Float this Topic for Current User
- Bookmark
- Subscribe
- Mute
- Printer Friendly Page
- Mark as New
- Bookmark
- Subscribe
- Mute
- RSS Feed
- Permalink
- Report Inappropriate Content
Hi all,
I am trying to calculate a forecast accuracy in SAS VA 8.5.2 and the absolute error is not correctly aggregating/summing.
Here is a table similar to the one I am working with:
| Brand | Actuals | Forecast | ABS Error (Abs(Actuals-Forecast) |
| A | 6,878 | 10,000 | 3,122 |
| B | 165,473 | 333,648 | 168,175 |
| C | 12,092 | 1,449 | 10,643 |
| Total | 184,443 | 345,097 | 160,654 |
The ABS Error is correct, but the total is incorrect. It is not recognizing that these values are positive. The total should be 181,940.
Due to this incorrect aggregation, my forecast accuracy calculation is coming out to an unexpected and incorrect value and I'm wondering how I can correct this.
Thanks in advance for your help!
Accepted Solutions
- Mark as New
- Bookmark
- Subscribe
- Mute
- RSS Feed
- Permalink
- Report Inappropriate Content
Hi all!
I figured it out.
When creating a new calculated value for the abs(error) make sure to change the result type from


Calculated fields switch to aggregated measure once you involve sum, but if you try to change it back, it errors out. So make sure to keep values as numeric so that each observation is calculated correctly (this will seem to be the case using either method, but where it falls apart is when you aggregate in visuals or total-up in a list table).
- Mark as New
- Bookmark
- Subscribe
- Mute
- RSS Feed
- Permalink
- Report Inappropriate Content
Sounds like you have the order operations wrongs.
You need to calculate ABS(actuals - forecast) first.
Then generate the bottom line as the sums of those three variables.
It looks instead you generated the sums first and then did the same abs(actuals - forecast) for the summary line as you did for the detail lines.
- Mark as New
- Bookmark
- Subscribe
- Mute
- RSS Feed
- Permalink
- Report Inappropriate Content
Hi Tom,
I'm sorry, I'm not following.
So right now I have 400,000 (ignore previous values) when I total absolute error value. This is calculated by
Abs(forecast - actuals)
But when summing up via list table total, I get a far lower number. Something around 180,000.
- Mark as New
- Bookmark
- Subscribe
- Mute
- RSS Feed
- Permalink
- Report Inappropriate Content
You have to figure out how to get VA to behave like normal analysis.
data have;
  input Brand $ Actuals Forecast;
cards;
A 6878 10000
B 165473 333648
C 12092 1449
;

data step1;
  set have;
  abs = abs(actuals - forecast);
run;

proc print;
 id brand;
 sum Actuals Forecast abs ;
run;
You either loaded that extra TOTAL row with the real data. Or you had it first calculate the totals and then asked it to take the difference of the totals. Like this:
proc summary data=have;
  var actuals forecast ;
  output out=totals(drop=_:) sum=;
run;

data step1;
  set have totals;
  abs = abs(actuals-forecast);
run;

proc print;
run;
You are doing the steps out of order.
- Mark as New
- Bookmark
- Subscribe
- Mute
- RSS Feed
- Permalink
- Report Inappropriate Content
Hey @illmatic! Based on the header of your list table, if your expression is this:
abs('forecast'n - 'actuals'n)
Then you should be good.
Based on what you have, it looks like Total is a part of your list table, which is why it's aggregating that way; however, this is the correct calculation for your overall forecast. Consider the following hypothetical forecast where the Total row is the sum of each column:
| Product | Forecast | Actual | Error | Abs Error |
| A | 0 | 100 | -100 | 100 |
| B | 300 | 200 | 100 | 100 |
| C | 300 | 300 | 0 | 0 |
| Total | 600 | 600 | 0 | 200 |
Total is a bottom-up forecast created by summing up products A, B, and C. The individual forecasts of A and B are off by -100 and 100 respectively, but the overall bottom-up forecast has an error of 0: the errors in products A and B cancel each other out to create a perfect overall forecast. If you're trying to figure out how good your individual forecasts are, this can be a deceptive metric if your individual forecasts aren't great. The sum of the absolute errors tells us there are 200 total errors among all of the individual forecasts, but it does not mean that the overall forecast has an absolute error of 200.
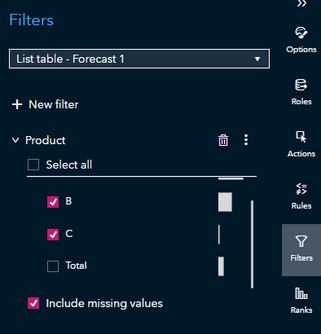
If you want to capture the total number of absolute errors of all forecasts, you need to remove the Total row and have Visual Analytics calculate the sum for you with the Totals option in a list table:
You can filter out your Total row with an object filter so you do not need to reload the data:
However, summing up all of the absolute errors is a relative measure and doesn't necessarily tell the whole story. One forecast could have a lot of errors while other forecasts could have a few. It's one indicator that there may be a problem with one or more forecasts, but it cannot be used to judge the accuracy of all hierarchical forecasts, especially if one hierarchy has large values while another hierarchy has low values. If you would like some good tips on how to judge the average accuracy of your hierarchical forecasts, I would recommend posting in the Forecasting and Econometrics forum.
Generally I have always looked at MASE or MAPE values and sorted them in ascending order to view how well individual forecasts are doing.
Check out my GitHub for SAS tips and tricks
Read my blog for cool SAS and open source data science projects
- Mark as New
- Bookmark
- Subscribe
- Mute
- RSS Feed
- Permalink
- Report Inappropriate Content
Thanks Stu!
My actual formula in VA looks like so:
Abs(Sum [_ByGroup_] (( 'Actuals'n - 'Forecast'n )))
does this change anything? Because total is not actually part of my table, but the output of VA when adding total for a list view. I only have it that way for the time being to troubleshoot why my forecast isn't coming out as expected.
And I understand why this can be deceptive or maybe not best practice, but I am also layering other views where a traditional MAPE is shown (no abs errorin calc) and even a SMAPE value. We just deemed the absolute forecast as the best way to show this forecast for a particular hierarchy to satisfy a particular vendor's SLA requirement.
- Mark as New
- Bookmark
- Subscribe
- Mute
- RSS Feed
- Permalink
- Report Inappropriate Content
Hi all!
I figured it out.
When creating a new calculated value for the abs(error) make sure to change the result type from


Calculated fields switch to aggregated measure once you involve sum, but if you try to change it back, it errors out. So make sure to keep values as numeric so that each observation is calculated correctly (this will seem to be the case using either method, but where it falls apart is when you aggregate in visuals or total-up in a list table).
See how to use one filter for multiple data sources by mapping your data from SAS’ Alexandria McCall.
Find more tutorials on the SAS Users YouTube channel.


