- Home
- /
- SAS Viya
- /
- Visual Analytics
- /
- How to plot time variable in VA
- RSS Feed
- Mark Topic as New
- Mark Topic as Read
- Float this Topic for Current User
- Bookmark
- Subscribe
- Mute
- Printer Friendly Page

- Mark as New
- Bookmark
- Subscribe
- Mute
- RSS Feed
- Permalink
- Report Inappropriate Content
Hello Experts,
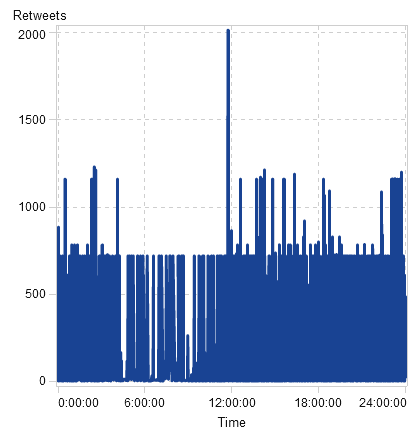
How do I plot time variable (like 00:05:05) again a numeric variable in VA? I tried time series but it only works for date variable rather than time variable...
If you use line chart then you lose the x axis label...(or scale).
I know there are many other charts can solve the problem but I really want to do the plot using chart similar to line chart
Thanks

- Mark as New
- Bookmark
- Subscribe
- Mute
- RSS Feed
- Permalink
- Report Inappropriate Content
Hello,
I am able to create a time series plot using a time variable:
Are you getting an error message when you try to apply a time variable to the time series plot? Also, what version of VA are you using? Can you show a screenshot of the properties for your time variable?
Thanks,
Sam

- Mark as New
- Bookmark
- Subscribe
- Mute
- RSS Feed
- Permalink
- Report Inappropriate Content
Hi gyambqt,
You can plot the time varaible in time series as well as bar chart which I had tried.May be there will be lot of other charts which can be used..
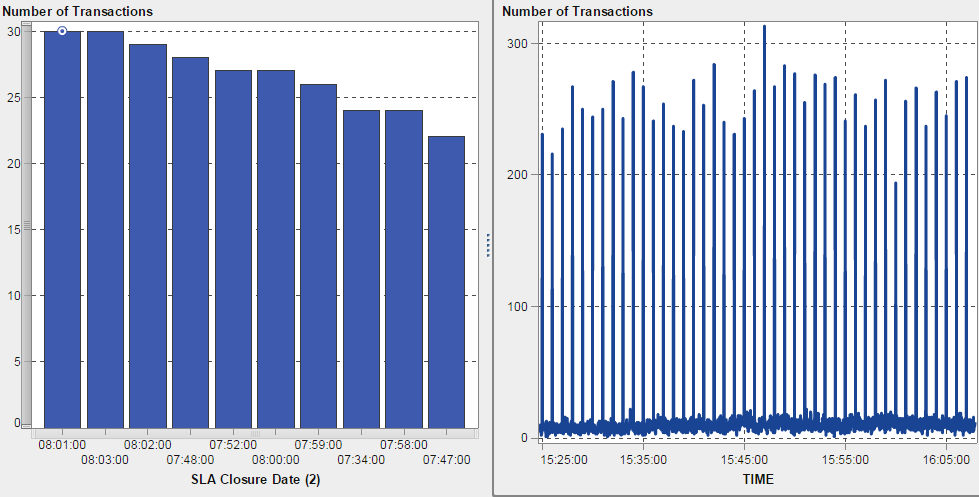
If you are getting issue while plotting the chart, try using "New Calculated Item" and use "Hour" or "Time Part" from "Date and Time Part" in operator section to get your variable in the appropriate format.
Thanks,
Abhishek
SAS Innovate 2025: Call for Content
Are you ready for the spotlight? We're accepting content ideas for SAS Innovate 2025 to be held May 6-9 in Orlando, FL. The call is open until September 25. Read more here about why you should contribute and what is in it for you!
See how to use one filter for multiple data sources by mapping your data from SAS’ Alexandria McCall.

Find more tutorials on the SAS Users YouTube channel.
-
2 replies
-
05-31-2015 07:46 PM
-
1122 views
-
0 likes
-
3 in conversation
-
