- Home
- /
- SAS Viya
- /
- Visual Analytics
- /
- Re: How to make forecast in report interactive?
- RSS Feed
- Mark Topic as New
- Mark Topic as Read
- Float this Topic for Current User
- Bookmark
- Subscribe
- Mute
- Printer Friendly Page

- Mark as New
- Bookmark
- Subscribe
- Mute
- RSS Feed
- Permalink
- Report Inappropriate Content
Hi,
I wonder if there is a workaround for export forecast (line plot) from exploration into report
and keep it interactive (responsive to new source data) as it is while in exporation.
The problem I experience:
When I create exploration with forecast a then export it into report - the report looks as it should.
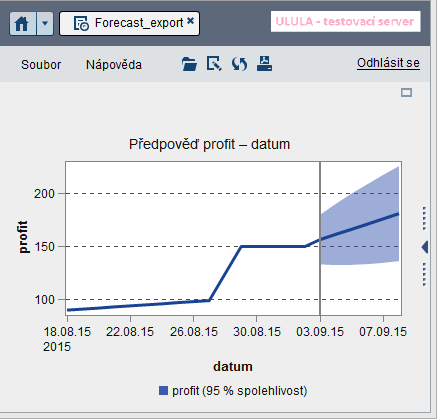
Then I updated the source LASR table (added few rows with further dates) and refreshed the report.
The slider/cursor remains in its previous position and marks the wrong date to be the latest.
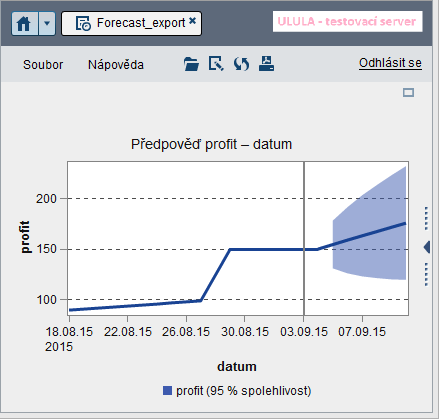
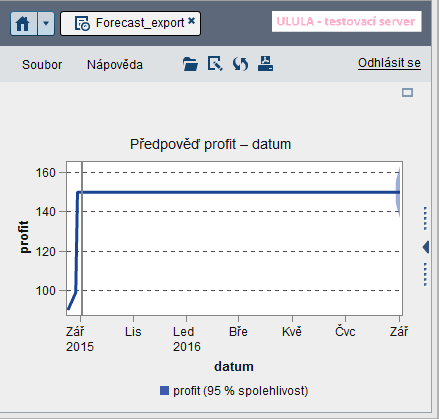
If I add whole year of further dates, the plot is zoomed out and the slider/cursor is still stucked
on date which was the latest in time the exploration was exported.
Thanks in advance.
Accepted Solutions

- Mark as New
- Bookmark
- Subscribe
- Mute
- RSS Feed
- Permalink
- Report Inappropriate Content
Hi,
I don't think what you're after is possible. As it states in the documentation at SAS(R) Visual Analytics 7.3: User's Guide - Export an Exploration as a Report, line charts with forecasting analysis are not available if the visualization has not been displayed during the current session.
It seems for a line chart with forecast to render correctly the visualization will need to be opened in the same session.
Kind Regards,
Michelle
- Mark as New
- Bookmark
- Subscribe
- Mute
- RSS Feed
- Permalink
- Report Inappropriate Content
Thank you.
Since this is not possible I also think there might be way to calculate upper and lower values of forecasting variable using IMSTAT procedure - FORECAST statement.
Then visualize this pre-calculated table in report. And calculate forecast every time I update source table (e.g. on daily basis).
But when I try to use FORECAST statement in SAS code (following this example) error emerges in log:
ERROR: Your software license does not provide the ability to exercise statistical functionality in the IMSTAT procedure, such as the FORECAST statement.
Is FORECAST statement of IMSTAT procedure licenced differently then IMSTAT procedure which comes with Visual Analytics?

- Mark as New
- Bookmark
- Subscribe
- Mute
- RSS Feed
- Permalink
- Report Inappropriate Content
You are correct - the use of the FORECAST statement in PROC IMSTAT requires a separate license.
Thanks,
Snurre
.jpg")
Catch up on SAS Innovate 2026
Nearly 200 sessions are now available on demand in the Innovate Hub.
Watch Now →See how to use one filter for multiple data sources by mapping your data from SAS’ Alexandria McCall.

Find more tutorials on the SAS Users YouTube channel.
-
3 replies
-
08-28-2015 08:16 AM
-
2674 views
-
0 likes
-
3 in conversation
-
