- Home
- /
- SAS Viya
- /
- Visual Analytics
- /
- How to find the first record date and last record date for each group
- RSS Feed
- Mark Topic as New
- Mark Topic as Read
- Float this Topic for Current User
- Bookmark
- Subscribe
- Mute
- Printer Friendly Page

- Mark as New
- Bookmark
- Subscribe
- Mute
- RSS Feed
- Permalink
- Report Inappropriate Content
I'm dealing with disease data which has two variabes: GroupID and Infection_date. For example:
| GroupID | Infection_date |
|---|---|
| A | 2014/01/03 |
| A | 2014/02/10 |
| A | 2014/03/05 |
| B | 2014/01/01 |
| B | 2014/02/01 |
| B | 2014/03/15 |
| B | 2014/03/15 |
Role type of GroupID is category and role type of Infection_date is date.
Now, I want to create a table contains the first infection date and last infection date for each GroupID like below:
| GroupID | First | Last |
|---|---|---|
| A | 2014/01/03 | 2014/03/15 |
| B | 2014/01/01 | 2014/03/15 |
I tried some different ways but none of them success. Dose any one have experience with this? Thanks a lot.

- Mark as New
- Bookmark
- Subscribe
- Mute
- RSS Feed
- Permalink
- Report Inappropriate Content
Hi,
Variety of ways spring to mind, this would be my choice:
proc sql;
create table WANT as
select COALESCE(A.GROUPID,B.GROUPID) as GROUPID,
A.INFECTION_DATE as FIRST,
B.INFECTION_DATE as LAST
from (select GROUPID,MIN(INFECTION_DATE) as INFECTION_DATE from HAVE group by GROUPID) A
full join (select GROUPID,MAX(INFECTION_DATE) as INFECTION_DATE from HAVE group by GROUPID) B
on A.GROUPID=B.GROUPID;
quit;

- Mark as New
- Bookmark
- Subscribe
- Mute
- RSS Feed
- Permalink
- Report Inappropriate Content
An easy way, assuming that DATE is actually numeric (SAS doesn't have a DATE type):
proc summary data=have nway;
var infection_date;
class groupID;
output out=want (keep=groupID first last) min=first max=last;
run;
You might need to apply a format to FIRST and LAST to view them as dates.

- Mark as New
- Bookmark
- Subscribe
- Mute
- RSS Feed
- Permalink
- Report Inappropriate Content
Another SQL:
proc sql;
create table WANT as
select GROUPID, MIN(INFECTION_DATE) as FIRST, MAX(INFECTION_DATE) as LAST
FROM HAVE
GROUP BY GROUPID
;
quit;
Haikuo
- Mark as New
- Bookmark
- Subscribe
- Mute
- RSS Feed
- Permalink
- Report Inappropriate Content
Thanks for all of your replies!
I forgot to mention that my platform is SAS Visual Analytics. So what I actually need is to build a "Report" in SAS VA 6.4 without any coding. All your suggestion are good on BASE SAS but not what I need. Thanks for your help again.

- Mark as New
- Bookmark
- Subscribe
- Mute
- RSS Feed
- Permalink
- Report Inappropriate Content
Hi
You just have to duplicate the date variable and rename it first date. Then change the aggregation to minimum.
The same goes for last date.
But you cant use the variable in filters.
BTW: There are a lot of helpful people in here, but they never notice that it is Visual Analytics forum, and always come up with answers in BASE SAS.
- Mark as New
- Bookmark
- Subscribe
- Mute
- RSS Feed
- Permalink
- Report Inappropriate Content
Thanks Allan
I've tried your method earlier, but only measure have aggregation option, date type variable doesn't.
Another method I'd try is use "TreatAs" operator to create new variable from Infection_date. This can correctly change date variable into measure. But it comes up another two problem:
1. I can't create max or min for each group. Aggregation work only when we use object with group role, but object "Table" doesn't have this concept.
2. Even if we create min and max successfully. Since these two variables are measure, we can't give them any date-like format.
then I stuck.....
- Mark as New
- Bookmark
- Subscribe
- Mute
- RSS Feed
- Permalink
- Report Inappropriate Content
Sorry, I forgot that you can't change format to date.
So, yes - you are stuck. :smileycry:

- Mark as New
- Bookmark
- Subscribe
- Mute
- RSS Feed
- Permalink
- Report Inappropriate Content
How did you get your data into VA in the first place? Can you derive what you need outside of VA and re-import it?
- Mark as New
- Bookmark
- Subscribe
- Mute
- RSS Feed
- Permalink
- Report Inappropriate Content
Our raw data is a sas dataset and store infection_date as numeric variable with yymmdd10. format.
VA will auto change numeric variable with date-like format into "date" category.
So make some change before import data can't solve it as I know.![]()
- Mark as New
- Bookmark
- Subscribe
- Mute
- RSS Feed
- Permalink
- Report Inappropriate Content
I was thinking along the lines of importing into VA the maximum and minimum dates for each group as described above. Would that help you with your issue? You should at least be able to filter on these.
- Mark as New
- Bookmark
- Subscribe
- Mute
- RSS Feed
- Permalink
- Report Inappropriate Content
Thanks Kiwi. It seems we can only use this preprocess method to achieve our goal. But this method against the spirit of VA, so we still looking for a better way.

- Mark as New
- Bookmark
- Subscribe
- Mute
- RSS Feed
- Permalink
- Report Inappropriate Content
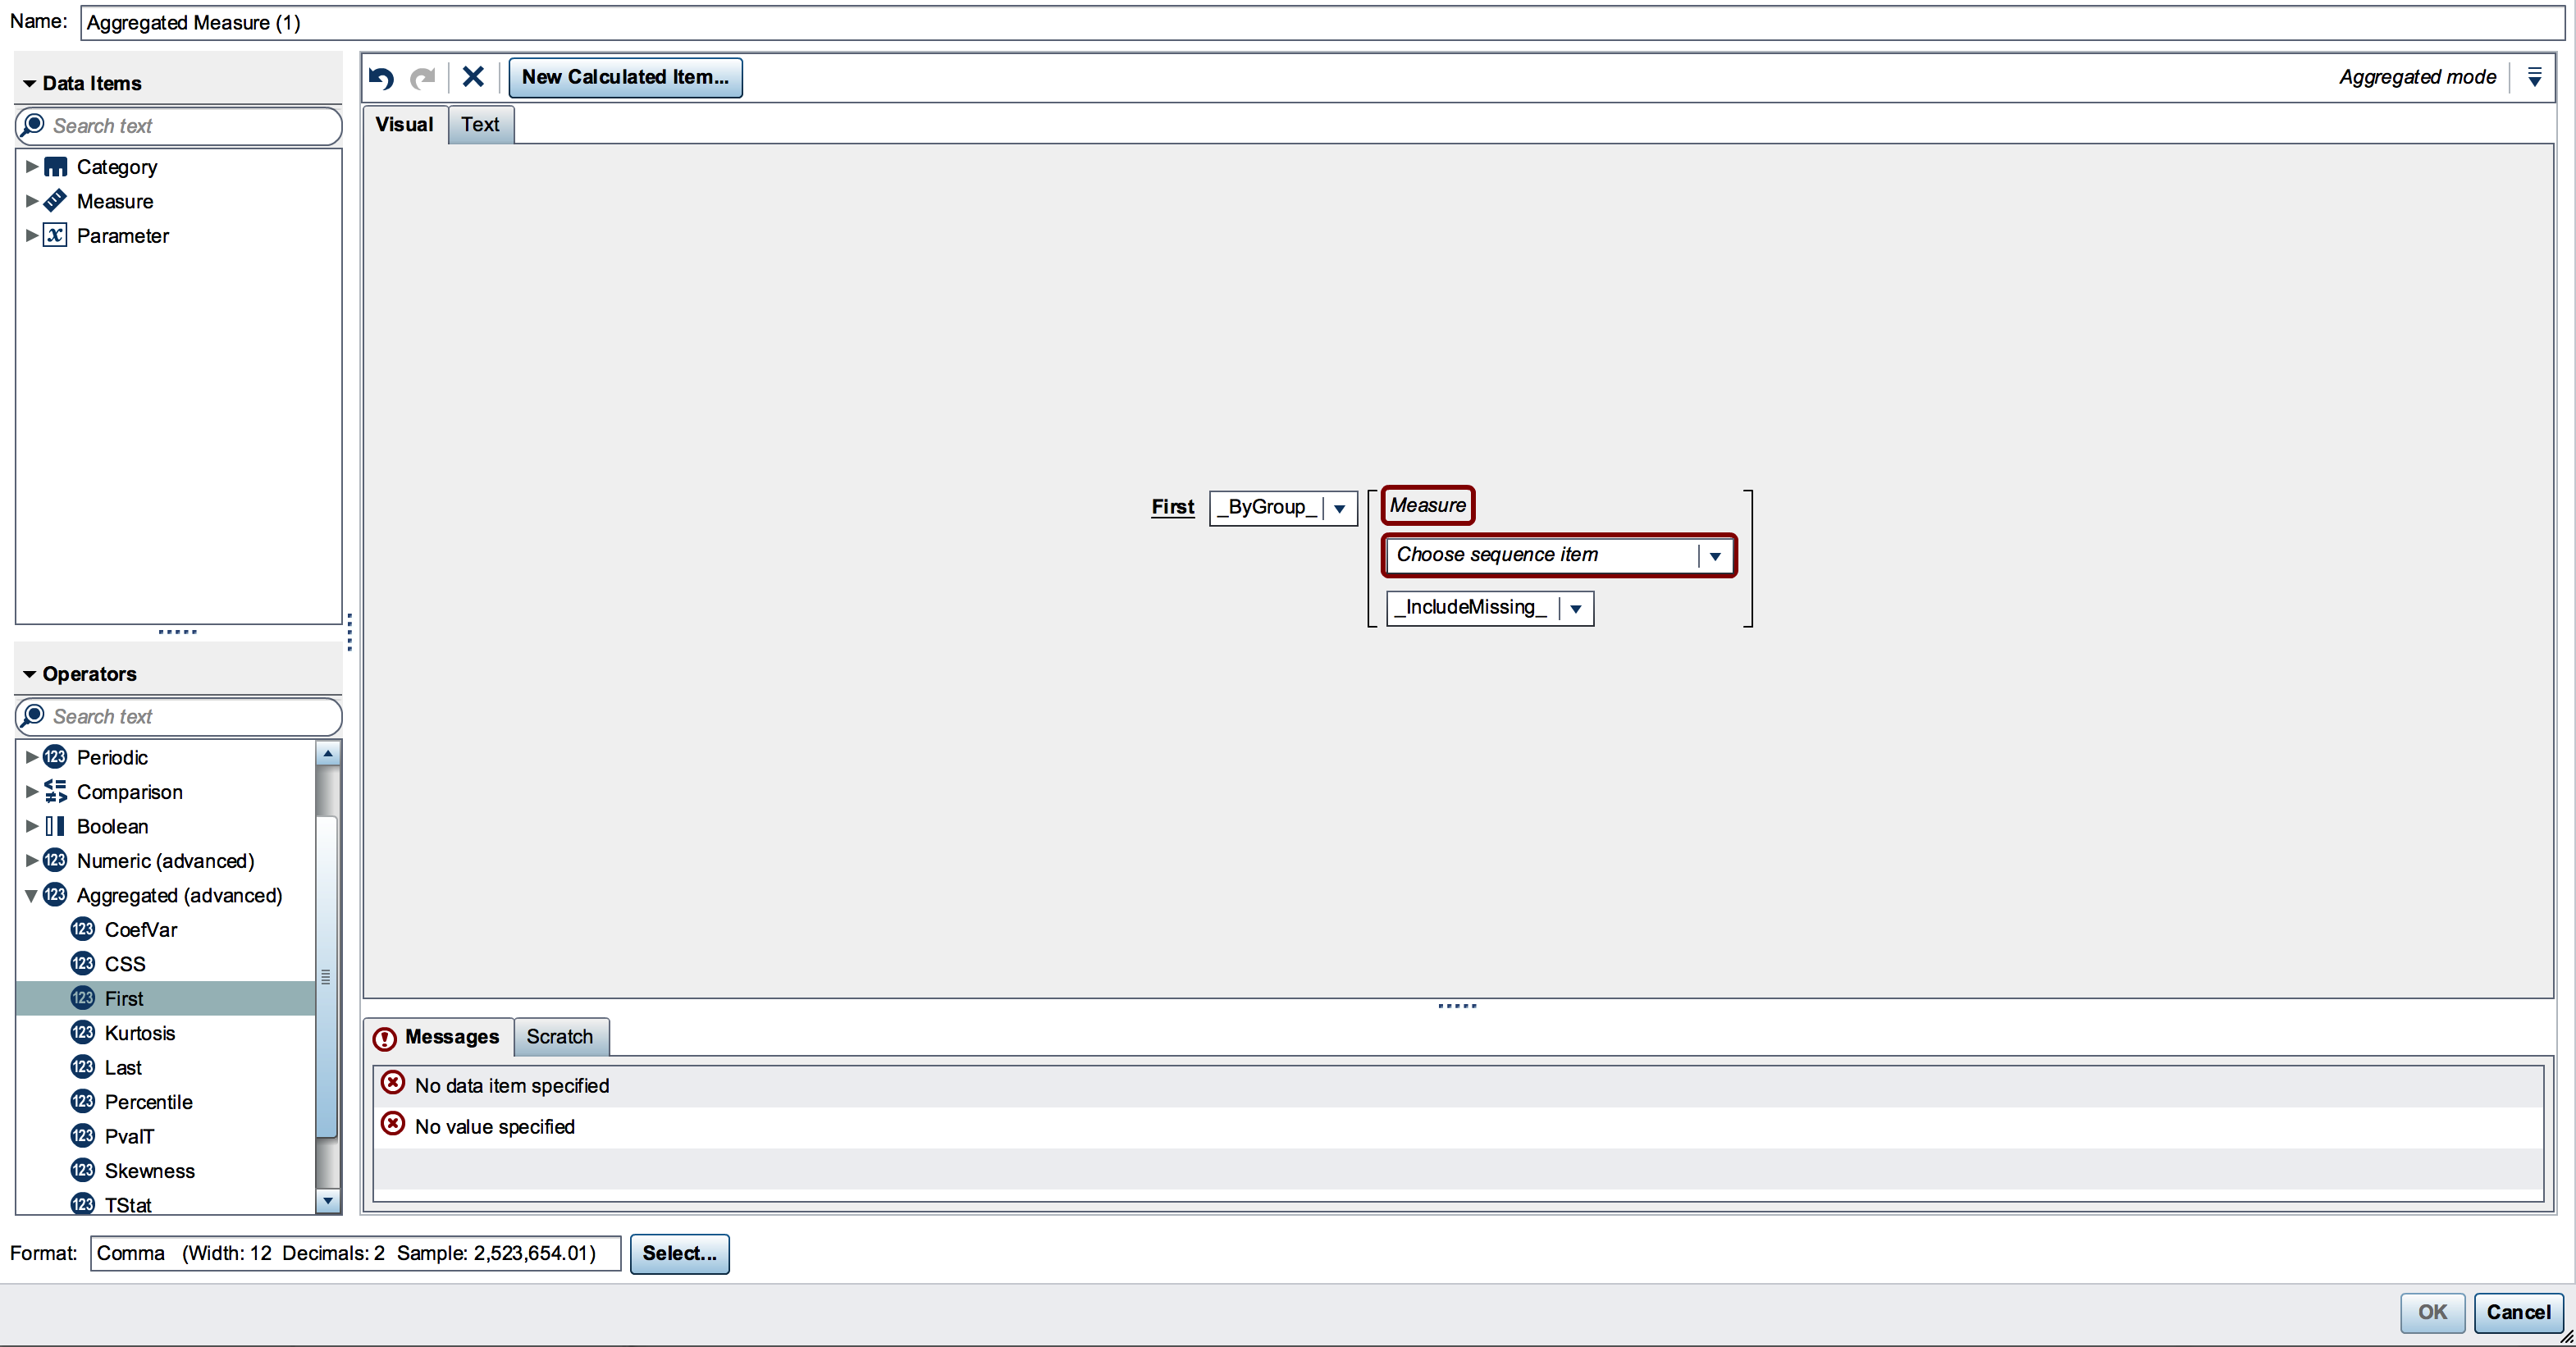
In Version Visual Analytics 7.1, You will be able to use first and last function as part of the calculation editor. This will be in Designer and Explorer. You must have a by group otherwise it would have been a default aggregation. Look for Visual Analytics 7.1 to release in October. This will be in the calculation editor with more aggregated values as well. More details to come.
Regards,
Ted Werner
- Mark as New
- Bookmark
- Subscribe
- Mute
- RSS Feed
- Permalink
- Report Inappropriate Content
Thanks Ted!!

- Mark as New
- Bookmark
- Subscribe
- Mute
- RSS Feed
- Permalink
- Report Inappropriate Content
Hi Ted,
We're now using 7.3 and I'm still trying to solve this puzzle. Am I doing something wrong or is it still not possible?
Thanx!
.jpg")
Catch up on SAS Innovate 2026
Nearly 200 sessions are now available on demand with the SAS Innovate Digital Pass.
Explore Now →See how to use one filter for multiple data sources by mapping your data from SAS’ Alexandria McCall.

Find more tutorials on the SAS Users YouTube channel.
-
14 replies
-
08-28-2014 09:24 AM
-
16891 views
-
0 likes
-
8 in conversation
-
