- Home
- /
- SAS Viya
- /
- Visual Analytics
- /
- How to do stacked bars to 100% in VA?
- RSS Feed
- Mark Topic as New
- Mark Topic as Read
- Float this Topic for Current User
- Bookmark
- Subscribe
- Mute
- Printer Friendly Page

- Mark as New
- Bookmark
- Subscribe
- Mute
- RSS Feed
- Permalink
- Report Inappropriate Content
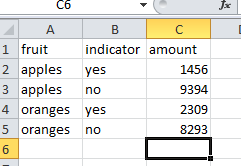
A very useful way to compare distributions that vary in size is stacked bar charts that add up to 100%. For example, excel has a 100% stacked column chart, which automatically converts to percentages and displays cells as a percent of the row or column total -- see attached example. So far I haven't found the magic combination to do this in SAS -- adding percents to a crosstab just converts each cell to a percent of the overall total, not a percent of the row or column total...help!

- Mark as New
- Bookmark
- Subscribe
- Mute
- RSS Feed
- Permalink
- Report Inappropriate Content
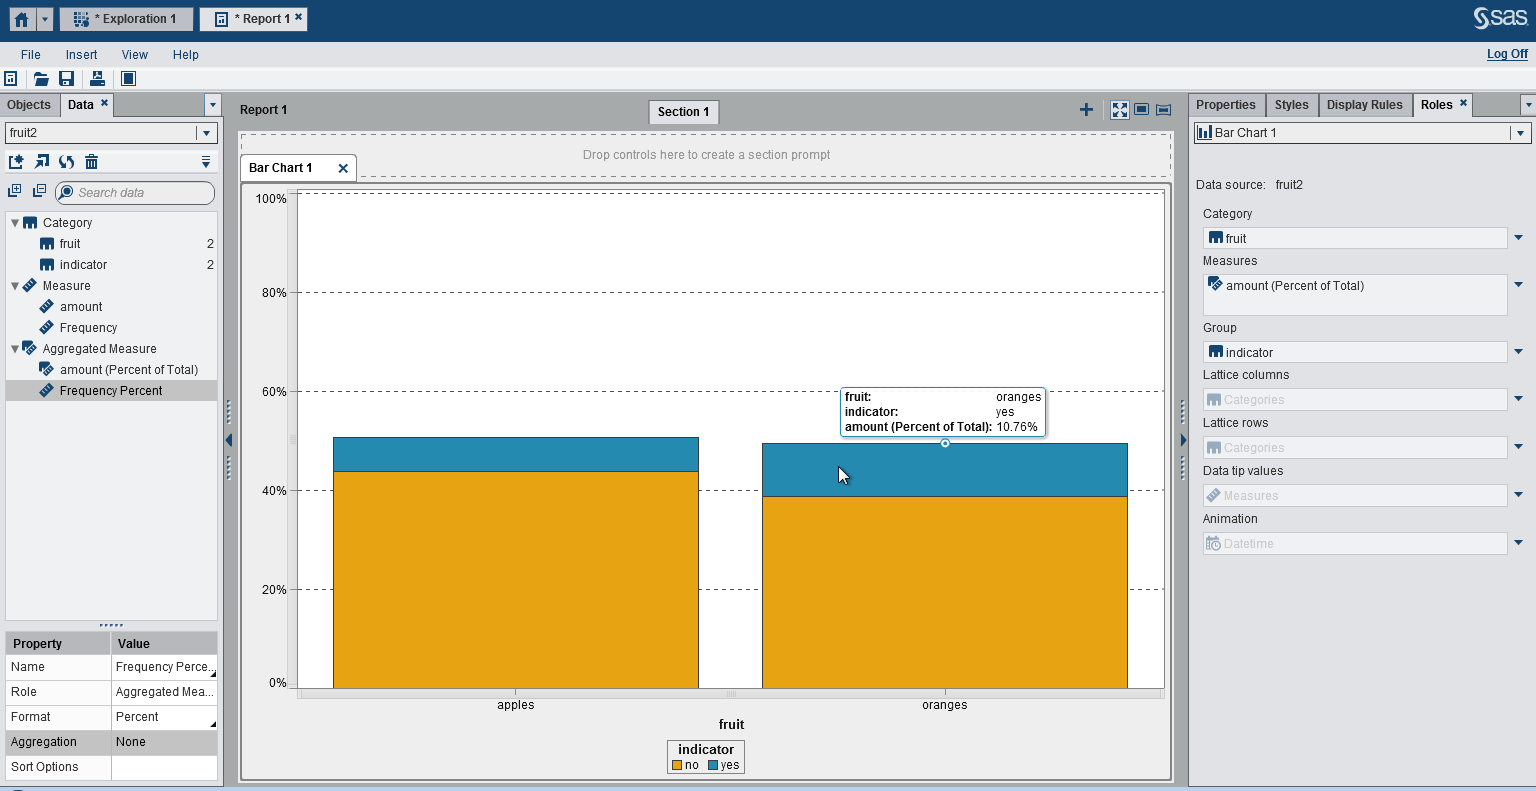
As you discovered and also in comment at The current version (VA 6.3) doesn't provide the functionality to do cumulative totals on generic categories; only for dates.
If it is of interest though you could using VA Designer to show the percentage of each category using a stacked bar chart as below. The data you provided needs to be rearranged to achieve this as follows:
Cheers,
Michelle
- Mark as New
- Bookmark
- Subscribe
- Mute
- RSS Feed
- Permalink
- Report Inappropriate Content
Very helpful -- thanks! Where did the "amount" measure come from -- did you calculate it, and if so, how? Granted I've been doing all my data prep in enterprise guide and have only worked with the reporting end of VA, but I don't see "amount" as a measure there...
- Mark as New
- Bookmark
- Subscribe
- Mute
- RSS Feed
- Permalink
- Report Inappropriate Content
Glad to see it is helpful.
I rearranged the table you had in your excel spreadsheet and created an amount column for the figures (see screenshot above). So amount is whatever your measurement column is. Compare my screenshot to what you provided in your attachment in your first post.
Cheers,
Michelle
- Mark as New
- Bookmark
- Subscribe
- Mute
- RSS Feed
- Permalink
- Report Inappropriate Content
And the light bulb blinks on... thanks!

- Mark as New
- Bookmark
- Subscribe
- Mute
- RSS Feed
- Permalink
- Report Inappropriate Content
There is a similar track that you may find useful: 100% Stacked Bar Charts

- Mark as New
- Bookmark
- Subscribe
- Mute
- RSS Feed
- Permalink
- Report Inappropriate Content
I got this to work by:
1. Create a new custom category with 1 label that includes the 100% of population
2. Define the above as the 'category' of the bar chart
3. Define the 'group' of the bar chart to be the breakdown of categories
.jpg")
Catch up on SAS Innovate 2026
Nearly 200 sessions are now available on demand with the SAS Innovate Digital Pass.
Explore Now →See how to use one filter for multiple data sources by mapping your data from SAS’ Alexandria McCall.

Find more tutorials on the SAS Users YouTube channel.
-
6 replies
-
01-21-2014 10:37 AM
-
8271 views
-
5 likes
-
4 in conversation
-
