- Home
- /
- SAS Viya
- /
- Visual Analytics
- /
- Re: Hierarchical Network Analysis/Diagram
- RSS Feed
- Mark Topic as New
- Mark Topic as Read
- Float this Topic for Current User
- Bookmark
- Subscribe
- Mute
- Printer Friendly Page
- Mark as New
- Bookmark
- Subscribe
- Mute
- RSS Feed
- Permalink
- Report Inappropriate Content
Hello there!
I would really appreciated any help that I can get. I am currently trying to work on Hierarchical Network Analysis on SAS VA and I cannot seem to get the outcome that I would want it to be.
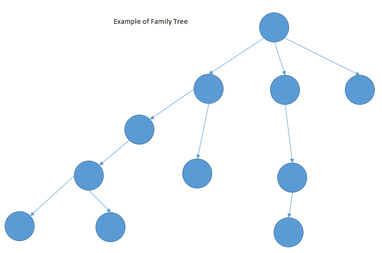
Attached is an image of the sample expected hierarchical network diagram that I would like to achieve. However, can anyone advise me if this is achievable in SAS VA?
Also, in the problem that I am tackling, the hierarchy levels for different entity is different and SAS VA does not seem to be able to omit the missing field from my data and as a result, nodes named "missing" will appear on my network diagram.
Thank you in advance!
Best regards,
Leon
- Mark as New
- Bookmark
- Subscribe
- Mute
- RSS Feed
- Permalink
- Report Inappropriate Content
Hi Leon,
Attaching data given your example. This very simple table has two columns for source and target. VA would render such data set as follow:
I'm not exactly sure what you mean with missing values. VA will automatically render all valid edges in your network structure. If you name a node 'missing' this would still represent a valid node name and therefore be included in your final network. You may want to consider not generating related rows (e.g. use a filter to exclude) or use a numeric column here and don't apply a value.
Hope this helps. Falko
- Mark as New
- Bookmark
- Subscribe
- Mute
- RSS Feed
- Permalink
- Report Inappropriate Content
Hi Falko,
Firstly, thank you so much for your response! The diagram in your response is exactly what I would like to achieve in my network diagram. However, I would like to enquire if that is achievable with the 'Hierarchical' option?
Attached contains images of my expected and actual outcome in SAS VA, as well as the test data that I used.
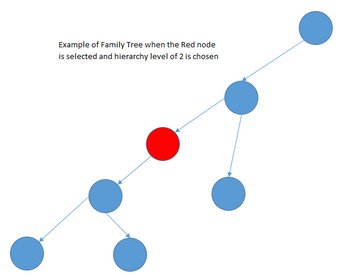
I am able to achieve the expected outcome with the 'Ungrouped' option as well, however, my concern is that subsequently, I am hoping to design a dashboard that is able to branch out from the node that we choose (i.e. the node that we choose will be node 0) and show the level of branching according to the hierarchy level chosen. I am unable to do that with the 'Ungrouped' option, hence I am trying to explore whether it is doable with the 'Hierarchical' option in VA.
Below are 2 images to illustrate the outcome that I am trying to achieve/work towards.

Thank you again and I hope to hear from you soon!
Best regards,
Leon
- Mark as New
- Bookmark
- Subscribe
- Mute
- RSS Feed
- Permalink
- Report Inappropriate Content
Hi Leon,
Yes, unfortunately hierarchical networks do render all values including missing values. I will send feedback to the development team and see whether this can be improved. There is not much value rendering nodes with missing value in unbalanced hierarchies - I agree. I should also mention that the hierarchical network (even while the name may suggest it) - is not truly hierarchical as it merges nodes with the same name on each level. For true hierarchical structures - it would be better to utilize things like org charts.
While VA currently does not support this visualization - you could look into data-driven content objects which let you embed any 3rd party graph visualizations.
Hope this helps. Regards, Falko
- Mark as New
- Bookmark
- Subscribe
- Mute
- RSS Feed
- Permalink
- Report Inappropriate Content
Thanks for the clarification. I shall look into the date-driven content objects then!
Best regards,
Leon
- Mark as New
- Bookmark
- Subscribe
- Mute
- RSS Feed
- Permalink
- Report Inappropriate Content
Hi Falko,
Following this thread subject, Hierarchical Network Diagram, I was surfing SAS website and found a very good example that will help me to accomplish my task as in the following link:
However, I am still looking around for the mentioned dataset in this URL so I can practice the graph first before loading my full dataset into SAS VIYA VA.
Would you please assist me with this?
- Mark as New
- Bookmark
- Subscribe
- Mute
- RSS Feed
- Permalink
- Report Inappropriate Content
Hi! Sorry for the delay in responding. I sent an email to our training team who put this example together. I will forward the sample data as soon I have it.
Meanwhile - you could also try the two examples in this discussion. While smaller examples - the overall data structure does not change. Building such network data set is very straightforward. The official VA doc also has some additional details/examples if required: https://go.documentation.sas.com/?docsetId=vaobj&docsetTarget=n0kcvb9vm0kd1sn1b199uu8hgq1w.htm&docse...
Thanks, Falko
- Mark as New
- Bookmark
- Subscribe
- Mute
- RSS Feed
- Permalink
- Report Inappropriate Content
Sorry for the delay in responding. Please find attached the two data sets used in the introduction training video.
Hope this helps. Regards, Falko
April 27 – 30 | Gaylord Texan | Grapevine, Texas
Registration is open
Walk in ready to learn. Walk out ready to deliver. This is the data and AI conference you can't afford to miss.
Register now and lock in 2025 pricing—just $495!
See how to use one filter for multiple data sources by mapping your data from SAS’ Alexandria McCall.
Find more tutorials on the SAS Users YouTube channel.


