- Home
- /
- SAS Viya
- /
- Visual Analytics
- /
- Dynamic header for the Line chart
- RSS Feed
- Mark Topic as New
- Mark Topic as Read
- Float this Topic for Current User
- Bookmark
- Subscribe
- Mute
- Printer Friendly Page

- Mark as New
- Bookmark
- Subscribe
- Mute
- RSS Feed
- Permalink
- Report Inappropriate Content
Hi All,
I have a report in VA with a list table and a Line chart, The list table has a interaction with the line chart.
Now I have a client requirement of dynamic header for the Line chart. The client whats that the character value selected in the list table to filter the Line chart should be seen in the header of the line chart.
For example:-
In list table I have a below column & values:-
Employe
Abc
Efg
Hij
An the line chart shows the trend of employees performance for the last 1 week.
So If i select the Employee Abc the Line chart will show the Trend for Abc. Now the requirement is that the header of the line chart should also show Abc. similarly if I will select Efg in the List table the header of Line chart should show Efg and so on.
Is this possible in VA 7.1? If yes can anyone please share the steps to do so.
Regards,
Swapna
Accepted Solutions

- Mark as New
- Bookmark
- Subscribe
- Mute
- RSS Feed
- Permalink
- Report Inappropriate Content
Hi Swapna,
I got the same requirement from my client in previous project.
Unfortunately Dynamic header option is also not available in present version, this is a very basic requirement we hope that this option will available in future versions.
instead of header, i designed this view for my client in that time.
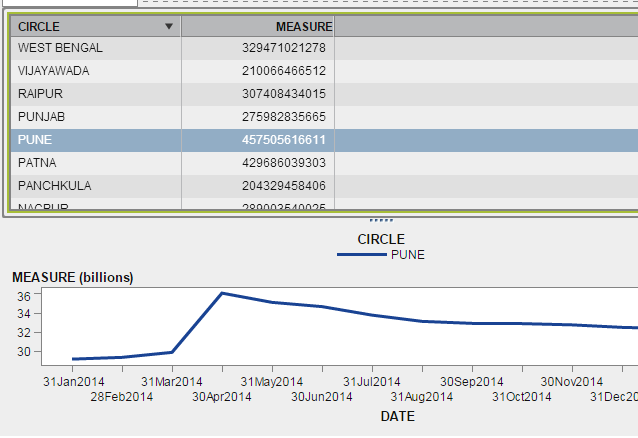
This is just alternative.
I hope that this will help you.
Regards,
Teja Surapaneni.
- Mark as New
- Bookmark
- Subscribe
- Mute
- RSS Feed
- Permalink
- Report Inappropriate Content
Hi Swapna,
I got the same requirement from my client in previous project.
Unfortunately Dynamic header option is also not available in present version, this is a very basic requirement we hope that this option will available in future versions.
instead of header, i designed this view for my client in that time.
This is just alternative.
I hope that this will help you.
Regards,
Teja Surapaneni.
- Mark as New
- Bookmark
- Subscribe
- Mute
- RSS Feed
- Permalink
- Report Inappropriate Content
Hi Teja,
Thank you for your reply.
What u did will definitely resolve my purpose.. ![]()
It would be really great if you can please share the steps on how did you do that.
As in line chart we can add only one date value and a measure, it seems that you are showing legend in the header. which really looks good, but I can't find how to get that in line chart.
Hence please share the steps.
Regards,
Swapna
- Mark as New
- Bookmark
- Subscribe
- Mute
- RSS Feed
- Permalink
- Report Inappropriate Content
Hey Teja,
No need to share the steps, I got it.. ![]()
Thanks it resolved my requirement.. ![]()
Regards,
Swapna
- Mark as New
- Bookmark
- Subscribe
- Mute
- RSS Feed
- Permalink
- Report Inappropriate Content
Hi Swapna;
Good to hear, we are happy....![]()
Regards,
Teja Surapaneni

- Mark as New
- Bookmark
- Subscribe
- Mute
- RSS Feed
- Permalink
- Report Inappropriate Content
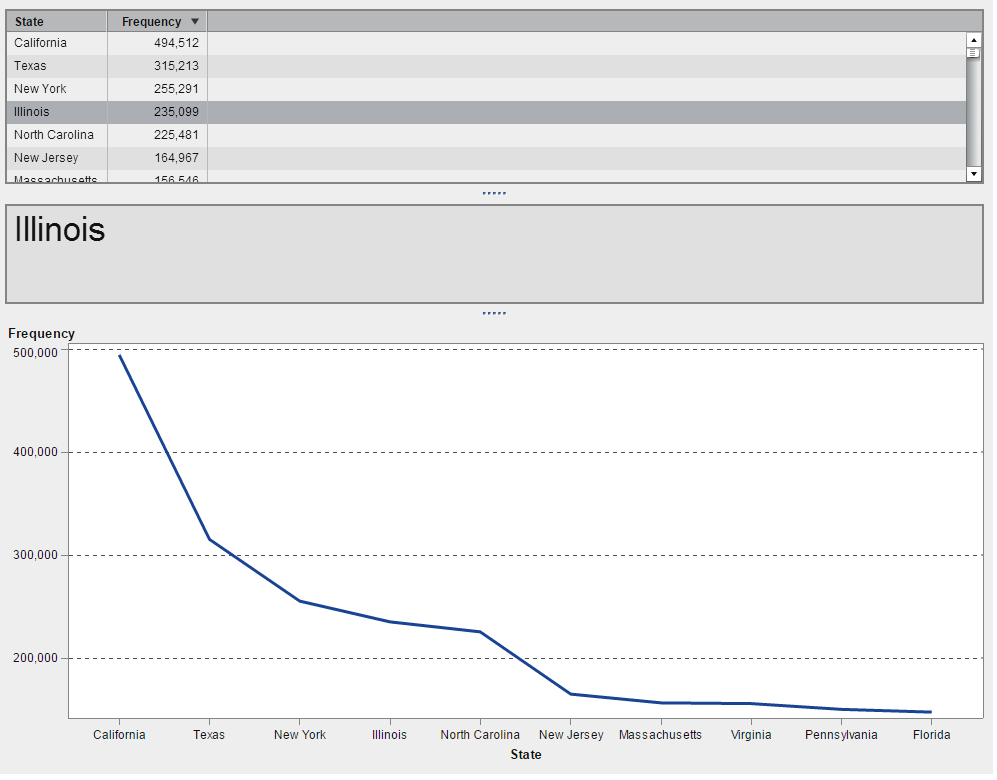
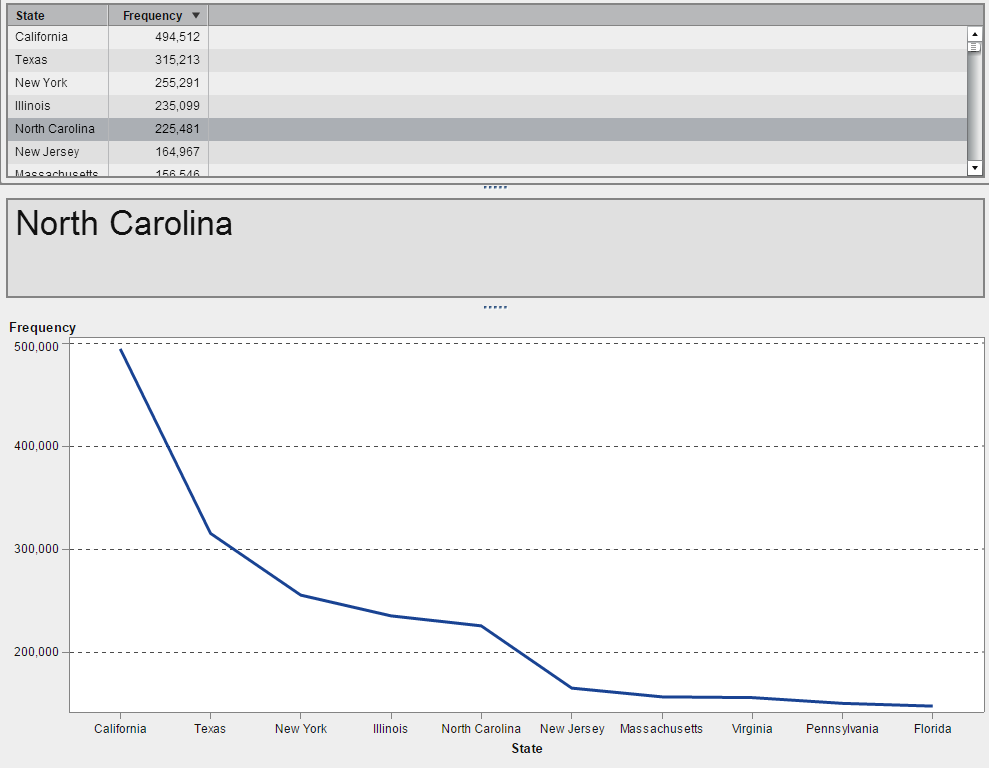
Swapna,
You could also create an interaction between your list table and a second list table that is formatted to appear like a header:
-shawn
.jpg")
Catch up on SAS Innovate 2026
Nearly 200 sessions are now available on demand in the Innovate Hub.
Watch Now →See how to use one filter for multiple data sources by mapping your data from SAS’ Alexandria McCall.

Find more tutorials on the SAS Users YouTube channel.
-
5 replies
-
04-10-2015 06:48 AM
-
3986 views
-
1 like
-
3 in conversation
-
