- Home
- /
- SAS Viya
- /
- Visual Analytics
- /
- Dynamic column name in list table
- RSS Feed
- Mark Topic as New
- Mark Topic as Read
- Float this Topic for Current User
- Bookmark
- Subscribe
- Mute
- Printer Friendly Page
- Mark as New
- Bookmark
- Subscribe
- Mute
- RSS Feed
- Permalink
- Report Inappropriate Content
Hello everyone,
I get the feeling that what I'm about to ask simply might not be possible.
I have a dataset with the columns Associate, ReportMonth, Month0, Month1, Month2, Month3, Month4 and Month5. In VA, my list table is designed so that ReportMonth variable is assigned to a drop down box which filters the table, a single ReportMonth value is required. Dummy data below:
| Associate | ReportMonth | Month0 | Month1 | Month2 | Month3 | Month4 | Month5 |
| Joe Bloggs | Jul-18 | 1 | 2 | 3 | 4 | 5 | 0 |
| Joe Bloggs | Jun-18 | 2 | 3 | 4 | 5 | 0 | 7 |
| Joe Bloggs | May-18 | 3 | 4 | 5 | 0 | 7 | 1 |
| Mary Sue | Jul-18 | 0 | 14 | 12 | 31 | 6 | 1 |
| Mary Sue | Jun-18 | 14 | 12 | 31 | 6 | 1 | 21 |
| Mary Sue | May-18 | 12 | 31 | 6 | 1 | 21 | 3 |
Month0-Month5 all relate to the same metric and together gives a 6 month history from the given report month backwards.
So, in July-18 Month0=July18, Month1=Jun18, Month2=May18, Month3=Apr18 etc.
In Jun-18 Month0=Jun18, Month1=May18, Month2=Apr18, Month3=Mar18 etc.
My list table only allows one ReportMonth to be viewed at once, so this means that the Month0-5 columns all mean the same for everything in the list table, but of course when a different report month is selected, they would mean something else. I'm hoping to be able to overwrite the Month0-Month5, with the actual calendar months they refer to.
Anyone done anything similar? As I say, I fear it's a longshot!
- Mark as New
- Bookmark
- Subscribe
- Mute
- RSS Feed
- Permalink
- Report Inappropriate Content
Hi TiffanyAching,
If have done something similar before. Note that you only can change the label name of a column not the column name.
Also note that code below is not optimized, but it show you all steps needed and will do the job.
Month code:
data Month_value ;
length Month_value $3  ;
input Month_value $3.;
datalines;
Jan
Feb
Mar
Apr
May
Jun
Jul
Aug
Sep
Oct
Nov
Dec
;
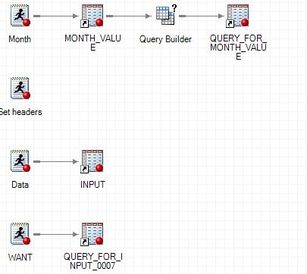
Query Builder with prompt
Add Month value in tab Select Data
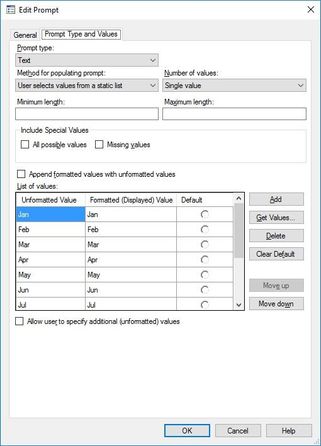
Create new prompt called 'Month_value'
Select option 'Use prompt value throughout project'
Add all months as values
Create new program 'Set header'
%MACRO setHeaders(Month_value=);
%GLOBAL Month0 Month1 Month2 Month3 Month4 Month5;
  %if &Month_value=Jun %then %do;
      %let Month0=Jul;
	  %let Month1=Aug;
	  %let Month2=Sep;
	  %let Month3=Oct;
	  %let Month4=Nov;
	  %let Month5=Dec;
  %end;
  %else %if &Month_value=Jul %then %do;

	  %let Month0=Aug;
	  %let Month1=Sep;
	  %let Month2=Oct;
	  %let Month3=Nov;
	  %let Month4=Dec;
	  %let Month5=Jan;
  %end;

%MEND setHeaders;

%setHeaders(Month_value=&Month_value);
Note that you add all the months. In the example I have added only 2
Create new program 'Data'
This will contain your data.
data work.input;

  input Associate $10. ReportMonth $4. Month0 3. Month1 3. Month2 3. Month3 3. Month4 3. Month5 3.;
  cards;
Joe Bloggs	Jul	01 02 03 04 05 00
Joe Bloggs	Jun	02 03 04 05 00 07
Joe Bloggs	May	03 04 05 00 07 01
Mary Sue 	Jul     01 41 23 01 06 01
Mary Sue 	Jun	14 12 31 06 12 01
Mary Sue 	May	12 31 06 12 01 03
;
run;
And last, create a program called 'Want'
PROC SQL;
   CREATE TABLE WORK.QUERY_FOR_INPUT_0007 AS
   SELECT t1.Associate,
          t1.ReportMonth,
          t1.Month0,
          t1.Month1,
          t1.Month2,
          t1.Month3,
          t1.Month4,
          t1.Month5
      FROM WORK.INPUT t1
      WHERE %_eg_WhereParam( t1.ReportMonth, Month_value, CONTAINS, TYPE=S, IS_EXPLICIT=0 );
QUIT;


proc datasets lib=work nolist;
    modify QUERY_FOR_INPUT_0007;
    label Month0=&Month0;
	label Month1=&Month1;
	label Month2=&Month2;
	label Month3=&Month3;
	label Month4=&Month4;
	label Month5=&Month5;

run; quit;
If you run all from the top, you see that the labels of the month colums are changing with each month selection you have done.
If you add a listdata for example, you will see the correct column names.
Hope this will be usefull in some kind of way.
Daniël
See how to use one filter for multiple data sources by mapping your data from SAS’ Alexandria McCall.
Find more tutorials on the SAS Users YouTube channel.


