- Home
- /
- SAS Viya
- /
- Visual Analytics
- /
- Re: Display Rules and Alerts
- RSS Feed
- Mark Topic as New
- Mark Topic as Read
- Float this Topic for Current User
- Bookmark
- Subscribe
- Mute
- Printer Friendly Page

- Mark as New
- Bookmark
- Subscribe
- Mute
- RSS Feed
- Permalink
- Report Inappropriate Content
I am tracking sales of different states in India and User_State is a column. I want to know if it is possible to state a different display rule for every state. Sales targets are different for different states so I cannot make one report level display rule for all the states. Same question for alerts. If sales on a particular day fall below a certain level, the state head must receive an alert. As targets are different for every state, I cannot make one alert for all states.

- Mark as New
- Bookmark
- Subscribe
- Mute
- RSS Feed
- Permalink
- Report Inappropriate Content
Hi Manish,
I don't think you can currently do that, unless you create multiple objects (one for each state using filters). Being individual objects, you are allowed to define independent display rules and alerts. The drawback is that you will need to manage multiple objects.
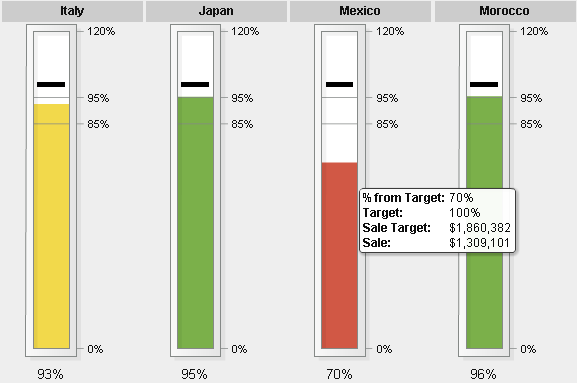
Another idea is to create a calculated column that normalizes the measures you are interested in and create a common rule/alert that applies to the normalized value. This second option is recommended, specially if you are using row level security: you could design one report and the proper state head would have his/her custom view for that report with only information about the assigned state, but still the rules would be the same for all state heads. I've created an example below where Target was set to 100% and Sales is showed as % of Sales over Target - defined as aggregated measure: ( ( Sum [_ByGroup_] ('Sale'n) - Sum [_ByGroup_] ('Sale Target'n) ) / Sum [_ByGroup_] ('Sale Target'n) ) + 1. Observe that you can still add the original Sales and Target values to the tooltip (in VA 6.4):
Best regards,
Renato
- Mark as New
- Bookmark
- Subscribe
- Mute
- RSS Feed
- Permalink
- Report Inappropriate Content
Thanks Renato for your reply. I will try out your suggested solution and will let you know!
.jpg")
Catch up on SAS Innovate 2026
Nearly 200 sessions are now available on demand with the SAS Innovate Digital Pass.
Explore Now →See how to use one filter for multiple data sources by mapping your data from SAS’ Alexandria McCall.

Find more tutorials on the SAS Users YouTube channel.
-
2 replies
-
03-23-2014 09:11 AM
-
3343 views
-
0 likes
-
2 in conversation
-
