- Home
- /
- SAS Viya
- /
- Visual Analytics
- /
- Re: Dashboard style number display
- RSS Feed
- Mark Topic as New
- Mark Topic as Read
- Float this Topic for Current User
- Bookmark
- Subscribe
- Mute
- Printer Friendly Page

- Mark as New
- Bookmark
- Subscribe
- Mute
- RSS Feed
- Permalink
- Report Inappropriate Content
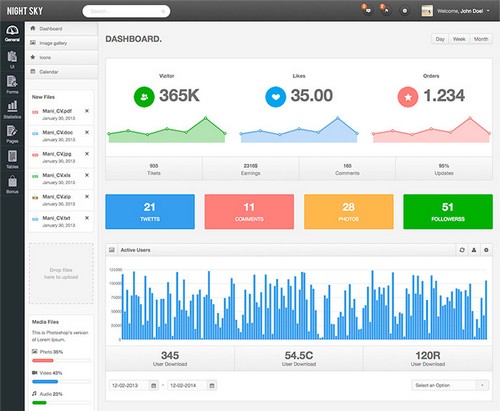
Hey everyone, Im just starting out using VA and really enjoying it so far, just wondering if anyone knows the best way of getting something similar to below... where there is 21 tweets ...
Basically id love to display high level tracking on a main dashboard page... and I would love to display either percentages or numbers without graphs and other objects.....
any idea how i can get something like the boxes below eg the 21 Tweets box or 11 Comments box
Cheers... and great to be here

- Mark as New
- Bookmark
- Subscribe
- Mute
- RSS Feed
- Permalink
- Report Inappropriate Content
Hi Rob,
This exact what you want in SAS VA....!!!!
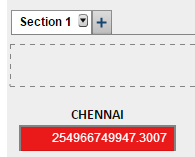
Thanks & Regards,
Teja Surapaneni
- Mark as New
- Bookmark
- Subscribe
- Mute
- RSS Feed
- Permalink
- Report Inappropriate Content
Awesome thanks Teja thats a great start. What have you used to get that effect?
Cheers
Rob
- Mark as New
- Bookmark
- Subscribe
- Mute
- RSS Feed
- Permalink
- Report Inappropriate Content
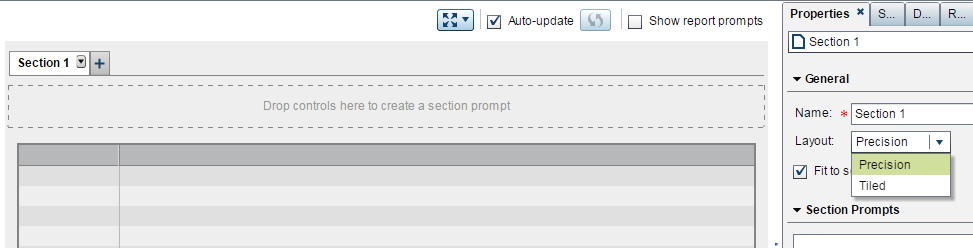
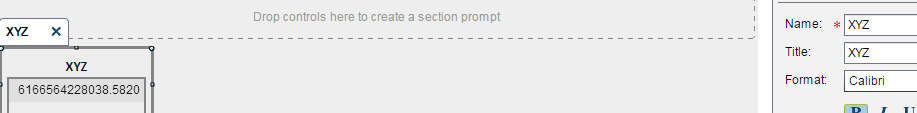
Hello Rob,
you can do this using list table, If you want i will share the steps...![]()
Thanks & Regards
Teja Surapaneni
- Mark as New
- Bookmark
- Subscribe
- Mute
- RSS Feed
- Permalink
- Report Inappropriate Content
That would be fantastic if you could. Ive done some stuff with tables but showing time series values etc... so if you could that would be great.
Cheers
Rob
- Mark as New
- Bookmark
- Subscribe
- Mute
- RSS Feed
- Permalink
- Report Inappropriate Content
Hi Rob,
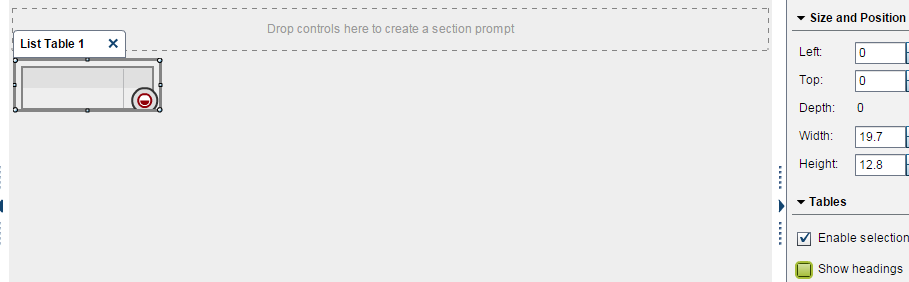
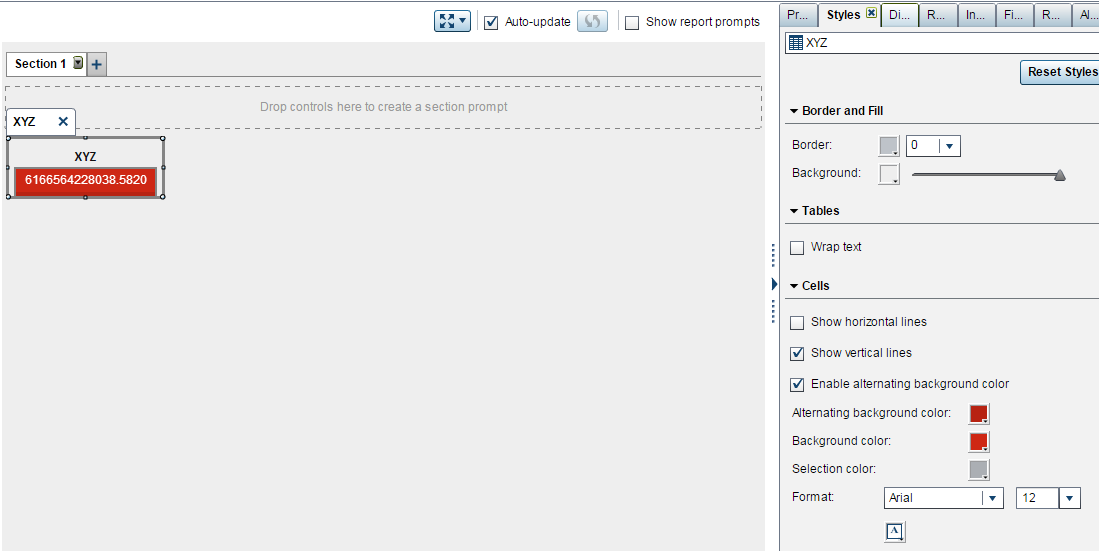
Hope this will help you,
Thanks & Regards,
Teja Surapaneni

- Mark as New
- Bookmark
- Subscribe
- Mute
- RSS Feed
- Permalink
- Report Inappropriate Content
Hi,
That's great idea. Thanks for sharing.. ☺
However, may I know how did you removed the extra column and row? Thanks! ☺

- Mark as New
- Bookmark
- Subscribe
- Mute
- RSS Feed
- Permalink
- Report Inappropriate Content
Welcome to the SAS Visual Analytics Community, Rob! We're glad you're here too. I hope you find some valuable input and information for your Visual Analytics work. Feel free to mark any correct or helpful answers on your discussion threads.
Best,
Anna
- Mark as New
- Bookmark
- Subscribe
- Mute
- RSS Feed
- Permalink
- Report Inappropriate Content
Awesome thanks Anna, thats a great idea and will do.
Cheers
Rob
.jpg")
Catch up on SAS Innovate 2026
Nearly 200 sessions are now available on demand in the Innovate Hub.
Watch Now →See how to use one filter for multiple data sources by mapping your data from SAS’ Alexandria McCall.

Find more tutorials on the SAS Users YouTube channel.
-
8 replies
-
06-20-2015 11:46 AM
-
6494 views
-
1 like
-
4 in conversation
-
