- Home
- /
- SAS Viya
- /
- Visual Analytics
- /
- Re: Crosstab - displaying issue
- RSS Feed
- Mark Topic as New
- Mark Topic as Read
- Float this Topic for Current User
- Bookmark
- Subscribe
- Mute
- Printer Friendly Page

- Mark as New
- Bookmark
- Subscribe
- Mute
- RSS Feed
- Permalink
- Report Inappropriate Content
Hello again,
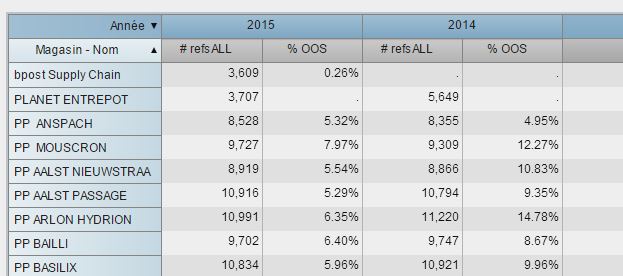
I got the following crosstab. But i want to see my measures on top, and my Year (annéé) below, so i can more easily compare them next to each other.
Note that my 2 measures are aggregated measures (# refsALL is a distinct count for example)

Any solutions, ideas?
Thanks in advance.
Filip

- Mark as New
- Bookmark
- Subscribe
- Mute
- RSS Feed
- Permalink
- Report Inappropriate Content
Hi, Filip
It is not possible in VA to show measures on TOP and Years in below. in my world. you have to change Data level structure...
Thanks,
Teja Surapaneni.
- Mark as New
- Bookmark
- Subscribe
- Mute
- RSS Feed
- Permalink
- Report Inappropriate Content
So you mean create a category for the measures?
- Mark as New
- Bookmark
- Subscribe
- Mute
- RSS Feed
- Permalink
- Report Inappropriate Content
Yes,
You have to create category xyz (ref, ODS) and measures(2015, 2014) on data set level.... but it is too complicated....
Thanks,
Teja Surapaneni.
- Mark as New
- Bookmark
- Subscribe
- Mute
- RSS Feed
- Permalink
- Report Inappropriate Content
I don't understand this is not possible within SAS VA. it's a very basic request.
Thanks for your answer, this confirms my idea.
.jpg")
Catch up on SAS Innovate 2026
Nearly 200 sessions are now available on demand in the Innovate Hub.
Watch Now →See how to use one filter for multiple data sources by mapping your data from SAS’ Alexandria McCall.

Find more tutorials on the SAS Users YouTube channel.
-
4 replies
-
02-18-2015 11:26 AM
-
2249 views
-
0 likes
-
2 in conversation
-
