- Home
- /
- SAS Viya
- /
- Visual Analytics
- /
- Re: Calculating frequency percentage by category in Visual Analytics 8...
- RSS Feed
- Mark Topic as New
- Mark Topic as Read
- Float this Topic for Current User
- Bookmark
- Subscribe
- Mute
- Printer Friendly Page
- Mark as New
- Bookmark
- Subscribe
- Mute
- RSS Feed
- Permalink
- Report Inappropriate Content
Hi all,
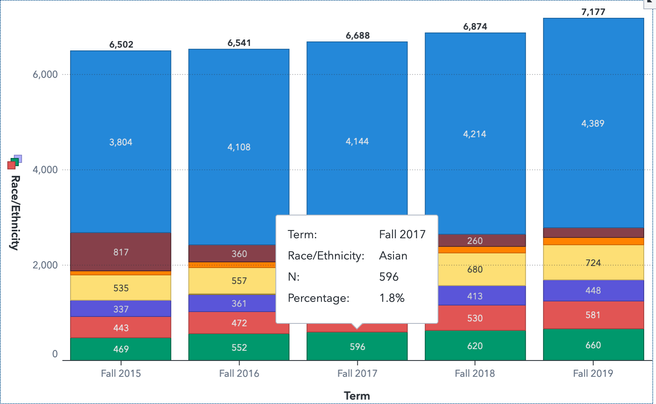
I am brand new to SAS Visual Analytics, so forgive me if there is an obvious answer to this question that I have missed (but I have searched this forum and have not found an answer). I am creating a stacked bar chart displaying the race/ethnicity (group) of a population over a 5 year period (category includes five values: 2015, 2016, 2017, 2018, 2019). I am displaying the frequency as my measure, but I would like the end user to be able to also see the frequency percent as a data tip. However, when I select frequency percent as a data tip value, the percentage is being calculated using the entire dataset's number of observations (all five years) as the denominator. What I want is to display the frequency percent using each distinct category's observations (i.e., each year's observations) as the denominator.
Someone posted a similar question to this forum and the response was to select "Normalize groups to 100%" in the options. While this does show the correct frequency percent (by year), it's not an ideal solution, because I lose the ability to visualize the magnitude of raw growth over time. I am attaching a screenshot of the problem below. For example, I want the frequency percent in the data tip to calculate the percentage of the Asian population in the Fall 2017 term as 596/6,688=8.9%, but the frequency percent is currently using the entire number of observations in the dataset (6,502+6,541+6,688+6,874+7,177) as the denominator.
Appreciate any help!
Thank you,
John
Accepted Solutions
- Mark as New
- Bookmark
- Subscribe
- Mute
- RSS Feed
- Permalink
- Report Inappropriate Content
Hello @JohnDooris
Welcome to our community! Yes, this is easily doable with the AggregateTable operator which you use to fix the aggregation to Term level.
For more information about AggregateTable: https://communities.sas.com/t5/SAS-Communities-Library/SAS-Visual-Analytics-Advanced-Calculations-pa...
Here's the New Calculated Item view:
Here's the code:
Sum [_ByGroup_] ('Population'n) / AggregateTable(_Sum_, Table(
_Sum_, Fixed('Term'n), 'Population'n))
And here's how it looks:
I hope this helps 😃
Best regards,
Petri
- Mark as New
- Bookmark
- Subscribe
- Mute
- RSS Feed
- Permalink
- Report Inappropriate Content
Thank you @PetriRoine !
See how to use one filter for multiple data sources by mapping your data from SAS’ Alexandria McCall.
Find more tutorials on the SAS Users YouTube channel.


