- Home
- /
- SAS Viya
- /
- Visual Analytics
- /
- Re: Adding a Variance column in a table
- RSS Feed
- Mark Topic as New
- Mark Topic as Read
- Float this Topic for Current User
- Bookmark
- Subscribe
- Mute
- Printer Friendly Page

- Mark as New
- Bookmark
- Subscribe
- Mute
- RSS Feed
- Permalink
- Report Inappropriate Content
Hi All,
This is hopefully a straight forward question and answer, but I will ask it anyway! I have a cross tab which is showing months going down, and then a measure showing 'sales'. The columns are split by a specific category with two options only saying 'Jeans' or 'T-shirts'. Is there a simple way to add an additional column to show the variance between these two categories, for example: if in Jul'13 there were 30 jean sales, and there were 40 T shirt sales, then there would be a measure to show a variance of -10 sales.
Any help would be greatly appreciated.
Kind regards,
Alex

- Mark as New
- Bookmark
- Subscribe
- Mute
- RSS Feed
- Permalink
- Report Inappropriate Content
Hi.
Would this work?
data have;
input month type $ sale;
datalines;
5 Jeans 20
5 Tee 30
6 Jeans 20
6 Tee 20
7 Jeans 15
7 Tee 10
;
run;
proc sort data = have;by month;run;
data want;
set have;
by month;
diff = sale - lag(sale);
if first.month then diff = .;
run;
*depending on what you need, you may also want this;
data want(keep = month diff);
set have;
by month;
diff = sale - lag(sale);
if first.month then diff = .;
if last.month;
run;
data really_want;;
merge have want;
by month;
run;
Good luck,
Anca
- Mark as New
- Bookmark
- Subscribe
- Mute
- RSS Feed
- Permalink
- Report Inappropriate Content
Hi Anca,
Thanks for this, but unfortunately this is something I want to do directly in SAS VA, rather than change the underling data!
Cheers,
Alex
- Mark as New
- Bookmark
- Subscribe
- Mute
- RSS Feed
- Permalink
- Report Inappropriate Content
Hi All,
I still don't have a solution to this issue, can anyone please assist?
Kind regards,
Alex

- Mark as New
- Bookmark
- Subscribe
- Mute
- RSS Feed
- Permalink
- Report Inappropriate Content
Hi Alex,
Sorry to hear you are still waiting for a solution...
You can create a new calculated data item that is an aggregated measure and then use this within your SAS VA crosstab object. Details on how to create an aggregated measure can be found at SAS(R) Visual Analytics 6.4: User's Guide Your calculation would be using something like... Sum ByGroup(X) - Sum ByGroup(Y)
Perhaps you could include a screenshot of what you are trying to achieve?
Kind Regards,
Michelle

- Mark as New
- Bookmark
- Subscribe
- Mute
- RSS Feed
- Permalink
- Report Inappropriate Content
In this case, create a new calculated item by building simple expressions or you can use 'difference between months'. Right click on the measure and you will find 'create' and select the one that is more appropriate for your output.
All these can be performed directly in SAS VA with no use of SAS codes.
cheers!
satlr
- Mark as New
- Bookmark
- Subscribe
- Mute
- RSS Feed
- Permalink
- Report Inappropriate Content
Hi All,
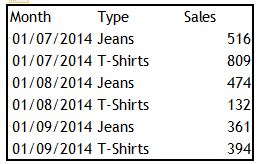
Thanks for your help with this, with the structure my data is in (which has to stay in this structure), I'm still not clear how this can be done. I use calculated items and aggregated fields quite often, but this does not look simple. For instance the Jeans and T-Shirts are in the same column (i.e. Sale Type), and so I would not be able to do a calculated measure as it would simply be SumbyGroup(Sales) - SumbyGroup(Sales). Here's an example of the data:
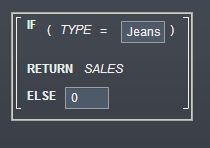
The only method I could see to do this, is to add a calculated item to something along the lines of:
However, if I then put a calculated aggregated measure of sumbygroup(Sales)-sumbygroup(JeanSales), I will then get something like this, which is input back into the Cross tab report, the issue is this will be placed as a measure under both categories, and as such will not calculate properly.
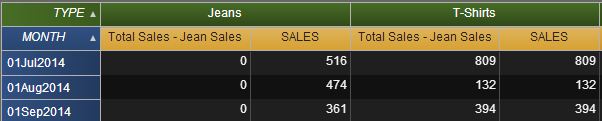
What I need is an additional category column called 'Variance', which simply works out variance between the two items and isn't a measure which goes underneath each of the Jeans/T-shirts columns, but I'm not sure this is possible in VA unless I get rid of the type category and just focus on adding in calculated items to evaluate the difference between the totals of each item.
Kind regards,
Alex
- Mark as New
- Bookmark
- Subscribe
- Mute
- RSS Feed
- Permalink
- Report Inappropriate Content
Hi Alex,
Thanks for providing the screenshots. Your thoughts in terms of added a calculated item with the boolean expression is a way to do this. You can create a Jeans data item and a T-Shirts data item with the boolean expressions you have specified. Then you can use a Table object rather than CrossTab where you will have MONTH, JEANS, T-SHIRTS. In the table you then want to add another column, Variance, which is calculated using an aggregated measure - Sum ByGroup(JEANS) - Sum ByGroup(T-SHIRTS). This will then be grouped by MONTH in your Table object as you have it as a column.
Unfortunately the CrossTab object doesn't have the option to calculate Variance or other measures such as percentages on the fly... a nice to have in a future release I think! 🙂
Kind Regards,
Michelle
- Mark as New
- Bookmark
- Subscribe
- Mute
- RSS Feed
- Permalink
- Report Inappropriate Content
you can create the variance if I am not wrong. right click on the measure and select the 'difference'. There are multiple options to select the variance. you also have option to show it as percentage. cheers!
satlr
- Mark as New
- Bookmark
- Subscribe
- Mute
- RSS Feed
- Permalink
- Report Inappropriate Content
Thanks both! I don't see the 'difference' option, perhaps this is in one of the newer versions ( I am still using 6.2), I think I may have to go with the table option for now, and not use a cross tab!
Cheers,
Alex
.jpg")
Catch up on SAS Innovate 2026
Nearly 200 sessions are now available on demand in the Innovate Hub.
Watch Now →See how to use one filter for multiple data sources by mapping your data from SAS’ Alexandria McCall.

Find more tutorials on the SAS Users YouTube channel.
-
9 replies
-
06-17-2014 07:33 AM
-
7820 views
-
5 likes
-
4 in conversation
-
