- Home
- /
- Programming
- /
- SAS Studio
- /
- Create a binary variable from two data files
- RSS Feed
- Mark Topic as New
- Mark Topic as Read
- Float this Topic for Current User
- Bookmark
- Subscribe
- Mute
- Printer Friendly Page
- Mark as New
- Bookmark
- Subscribe
- Mute
- RSS Feed
- Permalink
- Report Inappropriate Content
Hello everyone,
I have two data files that include patients' information on (1) the dose and duration of medications they take, and (2) whether or not they have had hospital readmissions. Here are parts of these data files (extracted for just one patient):
data drug;
input id dose_drug1 dose_drug2 date_start date_stop;
datalines;
1 7.5 5 01/17/2008 03/16/2008
1 22.5 3 03/20/2008 04/01/2008
1 30 8.5 08/07/2008 08/22/2008
1 15 5 11/23/2008 12/22/2008
;
data readmission;
input id readm_number date;
datalines;
1 1 02/20/2008
1 2 05/03/2008
1 3 07/10/2008
1 4 09/28/2008
1 5 11/09/2008
1 6 12/06/2008
;Now, I want to create another data file with new variables including dose of drug 1, dose of drug 2, duration of supply, and an indicator variable that takes binary (i.e., 0/1) values, where 1 implies that a hospital readmission occurred within a time window (e.g., 30 days, 60 days, etc.) after the drug supply. For example, for the case of 30-day time window, here is what I'm looking for:
data want_time_window_30;
input id dose_drug1 dose_drug2 duration indicator event_date;
datalines;
1 7.5 5 34 1 02/20/2008
1 7.5 5 25 0 .
1 22.5 3 12 0 .
1 30 8.5 15 0 .
1 15 5 13 1 12/06/2008
1 15 5 16 0 .
;
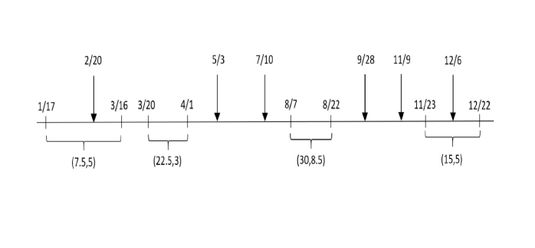
For example, the first event (i.e., hospital readmission) occurs on 02/20, which is in the middle of the first drug supply (from 01/17 to 03/16). That's why the duration (in the first line) becomes 34 days = 02/20-01/17. But, I still have drug supply after 02/20 (until 03/16). That's why I have the second line with the same drug dose, but with a different duration 25 days = 03/16-02/20 (also, the indicator variable is different between these two lines).
For your convenience, I provided the following time frame where the brackets represent drug supply periods (with the dose of drugs underneath), and vertical arrows represent the time of hospital readmissions.
data want_time_window_60;
input id dose_drug1 dose_drug2 duration indicator event_date;
datalines;
1 7.5 5 34 1 02/20/2008
1 7.5 5 25 1 05/03/2008
1 22.5 3 12 1 05/03/2008
1 30 8.5 15 1 09/28/2008
1 15 5 13 1 12/06/2008
1 15 5 16 0 .
;
Note that, if it is the 90-day time window, the only line that will be added to the lines above (between lines 4 and 5) is as follows:
1 30 8.5 15 1 11/09/2008I tried to be as demonstrative as possible, but if there is anything that should be further clarified, please let me know. Thank you very much, in advance, for your time and help!
- Mark as New
- Bookmark
- Subscribe
- Mute
- RSS Feed
- Permalink
- Report Inappropriate Content
@Alireza_Boloori I really need some further clarification on the data. OK, How would you lookup/join drug and readmission. The following is the output if you look up using merge by id, however when the merge statement processes the readmission #4(4th obs with drug, this will result in one to many merge as you see the below output table. You need to lead me from here.
/*trying to lookup*/
data lookup;
merge drug readmission;
by id;
interval_datestart_date=intck('day', date_start, date);
interval_datestop_date=intck('day', date, date_stop);
run;
Result of lookup:
| id | dose_drug1 | dose_drug2 | date_start | date_stop | readm_number | date | interval_datestart_date | interval_datestop_date |
| 1 | 7.5 | 5 | 1/17/2008 | 3/16/2008 | 1 | 2/20/2008 | 34 | 25 |
| 1 | 22.5 | 3 | 3/20/2008 | 4/1/2008 | 2 | 5/3/2008 | 44 | -32 |
| 1 | 30 | 8.5 | 8/7/2008 | 8/22/2008 | 3 | 7/10/2008 | -28 | 43 |
| 1 | 15 | 5 | 11/23/2008 | 12/22/2008 | 4 | 9/28/2008 | -56 | 85 |
| 1 | 15 | 5 | 11/23/2008 | 12/22/2008 | 5 | 11/9/2008 | -14 | 43 |
| 1 | 15 | 5 | 11/23/2008 | 12/22/2008 | 6 | 12/6/2008 | 13 | 16 |
- Mark as New
- Bookmark
- Subscribe
- Mute
- RSS Feed
- Permalink
- Report Inappropriate Content
@novinosrin Thanks for your thoughts! I had to add many other steps to it. The thing I was looking for was more detailed and complicated than I originally thought.
- Mark as New
- Bookmark
- Subscribe
- Mute
- RSS Feed
- Permalink
- Report Inappropriate Content
Alright. Should you have a clear flow of logic at any point ,repost your needs again.
April 27 – 30 | Gaylord Texan | Grapevine, Texas
Registration is open
Walk in ready to learn. Walk out ready to deliver. This is the data and AI conference you can't afford to miss.
Register now and save with the early bird rate—just $795!
Get started using SAS Studio to write, run and debug your SAS programs.
Find more tutorials on the SAS Users YouTube channel.
SAS Training: Just a Click Away
Ready to level-up your skills? Choose your own adventure.


