Turn on suggestions
Auto-suggest helps you quickly narrow down your search results by suggesting possible matches as you type.
Showing results for
- Home
- /
- Programming
- /
- Programming
- /
- re: proc tabulate percentages
Options
- RSS Feed
- Mark Topic as New
- Mark Topic as Read
- Float this Topic for Current User
- Bookmark
- Subscribe
- Mute
- Printer Friendly Page
☑ This topic is solved.
Need further help from the community? Please
sign in and ask a new question.
- Mark as New
- Bookmark
- Subscribe
- Mute
- RSS Feed
- Permalink
- Report Inappropriate Content
Posted 11-22-2022 02:00 PM
(891 views)
Hi.....I am trying to get the percentage of failures and successes for each year for each zone and plan. I can get the counts but can't seem to get the correct percentages. Any suggestions. Thanks.
data Have;
    length ID 8 Zone $ 1 Plan $ 6 Year 8 Outcome $ 7;
    format ID best12. Zone $char1. Plan $char6. Year best12. Outcome $char7.;
    informat ID  best12. Zone  $char1. Plan $char6. Year best12. Outcome $char7.;
    infile datalines4 dlm='7F'x missover dsd;
    input ID : best2. Zone : $char1. Plan : $char6. Year : best32. Outcome : $char7.;
datalines4;
1APlan A2020Success
2APlan A2020Success
3APlan A2020Failure
4APlan A2021Failure
5APlan A2021Failure
6APlan B2021Success
7APlan B2022Success
8APlan B2022Success
9BPlan A2022Failure
10BPlan A2022Failure
11BPlan B2022Failure
12BPlan B2022Success
13CPlan A2020Success
14CPlan A2020Failure
15CPlan B2021Success
16CPlan B2022Failure
;;;;

proc tabulate data=Have;
	var ID;
	class Year /	order=unformatted missing;
	class Outcome /	order=unformatted missing;
	class Zone /	order=unformatted missing;
	class Plan /	order=unformatted missing;
	table (Zone=' ' * (Plan=' ' all = 'Total' ) all = 'Total' ) ,(Year=' ' * (Outcome=' ' *(ID=' ' * N=' ' ) all = 'Total' *(ID=' ' * N=' ' )));;
run;
Have:
| 2020 | 2021 | 2022 | ||||||||
| Failure | Success | Total | Failure | Success | Total | Failure | Success | Total | ||
| A | Plan A | 1 | 2 | 3 | 2 | . | 2 | . | . | . |
| Plan B | . | . | . | . | 1 | 1 | . | 2 | 2 | |
| Total | 1 | 2 | 3 | 2 | 1 | 3 | . | 2 | 2 | |
| B | Plan A | . | . | . | . | . | . | 2 | . | 2 |
| Plan B | . | . | . | . | . | . | 1 | 1 | 2 | |
| Total | . | . | . | . | . | . | 3 | 1 | 4 | |
| C | Plan A | 1 | 1 | 2 | . | . | . | . | . | . |
| Plan B | . | . | . | . | 1 | 1 | 1 | . | 1 | |
| Total | 1 | 1 | 2 | . | 1 | 1 | 1 | . | 1 | |
| Total | 2 | 3 | 5 | 2 | 2 | 4 | 4 | 3 | 7 | |
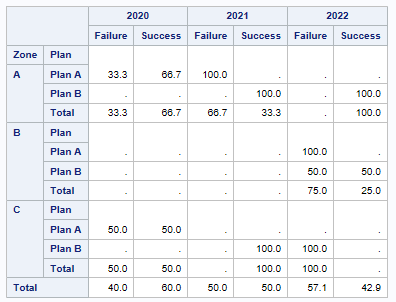
Want:
| 2020 | 2021 | 2022 | |||||
| Failure | Success | Failure | Success | Failure | Success | ||
| A | Plan A | 33.3% | 66.7% | 100.0% | |||
| Plan B | 100.0% | 100.0% | |||||
| Total | 33.3% | 66.7% | 66.7% | 100.0% | |||
| B | Plan A | 100.0% | |||||
| Plan B | 50.0% | 50.0% | |||||
| Total | 75.0% | 25.0% | |||||
| C | Plan A | 50.0% | 50.0% | ||||
| Plan B | 100.0% | 100.0% | |||||
| Total | 50.0% | 50.0% | 100.0% | 100.0% | |||
| Total | 40.0% | 60.0% | 50.0% | 50.0% | 42.9% | ||
1 ACCEPTED SOLUTION
Accepted Solutions
- Mark as New
- Bookmark
- Subscribe
- Mute
- RSS Feed
- Permalink
- Report Inappropriate Content
Try this
proc tabulate data = have;
   class Year Outcome Zone Plan / order=unformatted missing;
   var ID;
   table Zone * (Plan all = 'Total') all = 'Total'
       , Year='' * Outcome='' * PCTN<Outcome>=''*f=8.1;
run;
Result:
2 REPLIES 2
- Mark as New
- Bookmark
- Subscribe
- Mute
- RSS Feed
- Permalink
- Report Inappropriate Content
Try this
proc tabulate data = have;
   class Year Outcome Zone Plan / order=unformatted missing;
   var ID;
   table Zone * (Plan all = 'Total') all = 'Total'
       , Year='' * Outcome='' * PCTN<Outcome>=''*f=8.1;
run;
Result:
- Mark as New
- Bookmark
- Subscribe
- Mute
- RSS Feed
- Permalink
- Report Inappropriate Content
Thanks Peter...It worked!!!
How to Concatenate Values
Learn how use the CAT functions in SAS to join values from multiple variables into a single value.
Find more tutorials on the SAS Users YouTube channel.
SAS Training: Just a Click Away
Ready to level-up your skills? Choose your own adventure.


