- Home
- /
- Programming
- /
- Programming
- /
- Re: proc logistic - results
- RSS Feed
- Mark Topic as New
- Mark Topic as Read
- Float this Topic for Current User
- Bookmark
- Subscribe
- Mute
- Printer Friendly Page
- Mark as New
- Bookmark
- Subscribe
- Mute
- RSS Feed
- Permalink
- Report Inappropriate Content
Hi, all
Y is binary variable .
X1 is my primary interest . First, I did a simple T-test to compare sample observations that have X1 values below sample median vs. above sample median, what their Y value is, I found that below sample median firms are more likely to have Y=1, e.g. 32% of firms in the below sample median group have Y=1, In contrast, 27% of firms in the above sample median group have Y=1. That is to say Y and X1 is inversely related.
Next, I use proc logistic procedure
Y=X1 X2 X3 X4
proc logistic data= comb1 descending ;
model Y=X1 X2 X3 X4 ;
run;
now, my coefficient on X1 is positive and significant, that suggests Y and X1 are positively related. I checked VIF for multicollinearity, it does not seem to be an issue.
How should I reconcile this? Would this suggest X1 is positively related to Y?
Thanks !
Lan
- Mark as New
- Bookmark
- Subscribe
- Mute
- RSS Feed
- Permalink
- Report Inappropriate Content
Is SAS modeling the p(y=1) or p(y=0)? not sure how it treats the Y variable here.
usually i explicitly specify with model y (event='1') but the descending may already take care of that.
- Mark as New
- Bookmark
- Subscribe
- Mute
- RSS Feed
- Permalink
- Report Inappropriate Content
- Mark as New
- Bookmark
- Subscribe
- Mute
- RSS Feed
- Permalink
- Report Inappropriate Content
Are X2, X3 and X4 coefficients significant as well?
- Mark as New
- Bookmark
- Subscribe
- Mute
- RSS Feed
- Permalink
- Report Inappropriate Content
If you don't have too many tied values in X1--X4, you might get an idea of what's going on from the table :
proc rank data=comb1 out=testr groups=2;
var x1-x4;
ranks rx1-rx4;
run;
proc tabulate data=testr format=4.0;
class y rx1-rx4;
table rx1*rx2*rx3*rx4, y;
run;
PG
- Mark as New
- Bookmark
- Subscribe
- Mute
- RSS Feed
- Permalink
- Report Inappropriate Content
To PG:
yes, X2, X3 and X4 coefficients ARE significant.
question: what is the purpose of doing proc rank based on your last post? Please enlighten me.
To Reeza,
using descending option, SAS models the p(y=1). It is the same as using (event='1') option.
looking forward to everyone's response to my original post !!!
Lan
- Mark as New
- Bookmark
- Subscribe
- Mute
- RSS Feed
- Permalink
- Report Inappropriate Content
Proc rank with groups=2 creates two groups for each variable. Group=0 for values less than the median and group=1 for values above. The same idea you had tried, extended to all four variables and combined in a table with proc tabulate.
PG
- Mark as New
- Bookmark
- Subscribe
- Mute
- RSS Feed
- Permalink
- Report Inappropriate Content
Thanks, PG.
By doing what you suggested, would it help explain why the coefficient on X1 is opposite of the expected relation between X1 and Y using T-test, that is, logit regression gives a positive coefficient on X1 , but T-test suggests that high X1 values are correlated with low probability of Y=1 events.
Lan
- Mark as New
- Bookmark
- Subscribe
- Mute
- RSS Feed
- Permalink
- Report Inappropriate Content
The initial check you did was a worthwhile investigation, but it may be the source of your confusion. Y=1 32% of the time below X1's median and 27% above it. That is not a huge difference, and depending on your sample size may not be signficant in itself. Any of X2-X4 could still provide a much stronger signal than X1, causing this reversal. Can you post the parameter estimates table with significance tests? Also, try running logistic with X1 as the only explanatory variable...what is the result/significance?
Similarly, does your prior knowledge of the problem give you any insight into the relationship between the two variables? Would you expect any of X2-X4 to exhibit a stronger relationship with Y than X1?
- Mark as New
- Bookmark
- Subscribe
- Mute
- RSS Feed
- Permalink
- Report Inappropriate Content
It is also possible, since your X1 appears to be continuous, that all extreme values of X1 have Y=1 whereas the 32% below the median is distributed moreso randomly accross the n/2 cases. Maybe I need to review my log regression litterature but it appears to me as though if all your Y=1 above the median occur with your highest values of X1 with a few extreme values, that it would be reasonable, for the log odds of a shift of 1 unit in X1 to have a positive effect in a model.
If you output the proc logistic data (or maybe that is only availible with proc genmod) but there is an "influence" statistics. Try a model with only X1, sort the resulting dataset by X1 and take a look at the influence statistics column for the records with high values of X1
- Mark as New
- Bookmark
- Subscribe
- Mute
- RSS Feed
- Permalink
- Report Inappropriate Content
Per JohnW’s request, I am posting results below(see attached).
-Lan
- Mark as New
- Bookmark
- Subscribe
- Mute
- RSS Feed
- Permalink
- Report Inappropriate Content
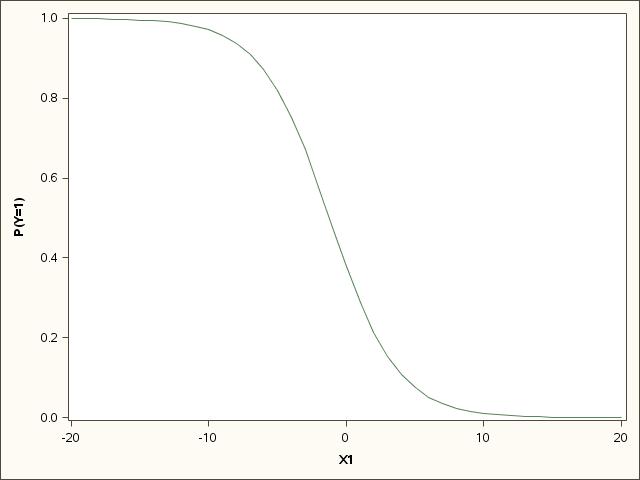
Interesting. The interaction is new and may help explain what's going on. On the univariate level, your model predicts as follows:

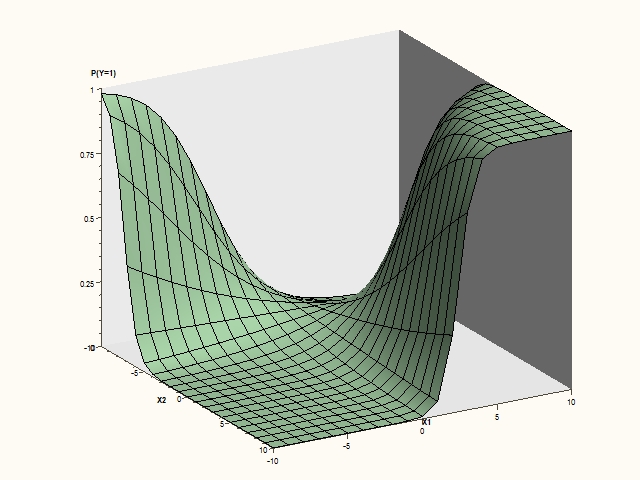
Your full model includes an interaction between X1 and X2 and therefore the impact of X1 depends on the value of X2. At the point where all other variables are equal to 0, your prediction is as follows (X2 is the left axis and X1 is the right axis, sorry for the small axis titles):

Here you can visualize that in certain parts of the predictor space (X2 negative), X1 has the inverse relationship with Y, while in others (X2 positive), X1 has a direct relationship with Y.
I hope this helps. To PGStats' point above, if you group your data (100 points in each group, or 1000...depending on how many observations), sorted by X1 (and X2), calculate the average response (between 0 and 1), and plot them, it may help visualize the relationship.
Learn how use the CAT functions in SAS to join values from multiple variables into a single value.
Find more tutorials on the SAS Users YouTube channel.
SAS Training: Just a Click Away
Ready to level-up your skills? Choose your own adventure.


