- Home
- /
- Programming
- /
- Programming
- /
- Re: independant t-test, is this approach correct? Root lenght measurem...
- RSS Feed
- Mark Topic as New
- Mark Topic as Read
- Float this Topic for Current User
- Bookmark
- Subscribe
- Mute
- Printer Friendly Page

- Mark as New
- Bookmark
- Subscribe
- Mute
- RSS Feed
- Permalink
- Report Inappropriate Content
hello,
I am helping someone with her statistical analyses for her biology master-dissertation ,
basically, i would like to know if my approach is correct. I will first explain the setup of the experiment:
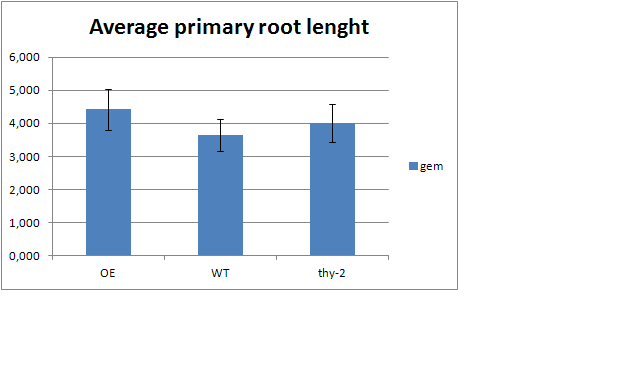
the study involves the response of 3 different types of mutants (:OE,WT or Ty-2) for a specific gene in the lenght of the primary root of a plant species. The measurements of the root lenghts were done on 2 different days and on 3 different concentrations of Nitrate. Because we only need to compare the root lenghts of the mutant types within a specific day for a specific concentration, there is no need to search for differences between concentration or between days. On e.g. day 9, (NO3-) 1mM, the average root lenghts of the three mutants look like this:
I thus thought i could do pairwise comparisons of the root lenghts of the mutants with independant t-tests (the root lenght of one mutant seedline is not affected by the measurements of those of the other mutant). Compare OE with WT, OE with Thy-2 and Wt with Thy-2 and putting the p-values on top of the bars with letters crowned with with asterixes . My first thought on this was to run an Anova (proc glm?) on the 3 mutants, but when upon reading articles, i find that they all only use pairwise comparisons using independant t-tests so i guess i can do this? When using an Anova i would do a post-hoc and end up with pairwise comparisons using t-tests anyway, is this a just assumption or should i use an anova despite of the articles doing otherwise?
For the t-test there is thus 1 independant categorical variable (mutant type) and 1 dependant continuous variable (root lenght) for each comparison to make.
is the following testing then correct?: for e.g. day 9, Nitrate concentration 1milliMolair(mM)
proc ttest data=thy2dag91mMthy2vsWT;
class expression;
var count;
run;
class because of the independant t-test, var lenght for testing equality of variances and the output gives me a qqplot where i can check for normality deviations (or should i do a proc univariate for testing normality) or mustn't I oblige to this assumtion if i find some of them are not normally distributed?
given the data:
data thy2dag91mMthy2vsWT; (the sample sizes for the two mutants are different in size due to some seeds not germinating)
input expression $ count;
cards;
thy-2 2.580
thy-2 3.296
thy-2 4.179
thy-2 4.298
thy-2 4.459
thy-2 2.986
thy-2 3.413
thy-2 4.419
thy-2 4.368
thy-2 3.849
thy-2 3.962
thy-2 3.718
thy-2 4.106
thy-2 4.456
thy-2 4.483
thy-2 4.345
thy-2 4.248
thy-2 4.311
thy-2 3.336
thy-2 3.720
thy-2 3.874
thy-2 3.030
thy-2 3.888
thy-2 4.492
thy-2 4.332
thy-2 4.231
thy-2 2.752
thy-2 4.567
thy-2 4.379
thy-2 4.807
thy-2 4.843
thy-2 3.791
thy-2 4.049
thy-2 2.950
thy-2 4.231
thy-2 4.141
thy-2 4.746
thy-2 4.463
thy-2 4.555
WT 3.885
WT 3.968
WT 3.259
WT 3.670
WT 3.572
WT 3.309
WT 3.803
WT 4.074
WT 3.991
WT 4.057
WT 3.786
WT 3.855
WT 3.635
WT 3.415
WT 3.462
WT 3.835
WT 3.976
WT 3.946
WT 3.567
WT 3.344
WT 3.630
WT 1.992
WT 3.605
WT 3.670
WT 3.837
WT 3.702
WT 3.784
WT 3.766
WT 1.884
WT 3.999
WT 3.937
WT 4.144
WT 3.537
WT 3.704
WT 3.657
WT 4.256
run;
kind regards,
Bas

- Mark as New
- Bookmark
- Subscribe
- Mute
- RSS Feed
- Permalink
- Report Inappropriate Content
Because we only need to compare the root lenghts of the mutant types within a specific day for a specific concentration, there is no need to search for differences between concentration or between days.
But yet these terms for concentration and day need to be included in the model somehow, so the model can account for the variability in the data caused by day and concentration, and not use this variability in determining the significance of root length differences.
After adding these terms into the model, you could do a PROC GLM or PROC MIXED (there are differences between these procedures) to test to see if the root lengths are different.
My first thought on this was to run an Anova (proc glm?) on the 3 mutants, but when upon reading articles, i find that they all only use pairwise comparisons using independant t-tests so i guess i can do this?
I don't know what you were reading, but PROC GLM does not "only use pairwise comparisons". I specifically object to the word ONLY. PROC GLM provides a multitude of tests that may be appropriate here, including the overall ANOVA F-test which is not a pairwise test; and including pairwise comparison tests.
Thus, I can imagine a model that goes something like this (details are still subject to further clarification)
PROC GLM;
class day expression concentration;
model count=day concentration expression; /* Presence or absence of interactions is up to the modeler's discretion here */
means expression/t lines; /* Options chosen here are up to the modeler's discretion */
run;
quit;
Paige Miller

- Mark as New
- Bookmark
- Subscribe
- Mute
- RSS Feed
- Permalink
- Report Inappropriate Content
This is a horribly inadequate analysis, and fails to account for correlated responses over time within a subject and to the different levels of nitrate applied. If it is submitted for publication to any of the Agronomy journals that I am familiar with, it will be rejected.
Reformat the data to include nitrate level, day and subject.
Try the following then:
proc mixed data=newdata;
class day nitrate expression subjectid; /*This assumes that root length was measured on the same plant, or on similar plants in a plot */
model count=day|nitrate|expression;
repeated day/subject=subjectid;
lsmeans day|nitrate|expression;
slice day*nitrate*expression/sliceby=day*nitrate diff;
run;
The slice statement gives the extension of the t-test you propose, testing differences on each day at each nitrate level concentration.
There are still multiple testing, variance homogeneity, and distributional questions to be addressed, but this PROC MIXED approach will reflect the experimental design, and is a good start.
Steve Denham
.jpg")
Catch up on SAS Innovate 2026
Nearly 200 sessions are now available on demand in the Innovate Hub.
Watch Now →Learn how use the CAT functions in SAS to join values from multiple variables into a single value.

Find more tutorials on the SAS Users YouTube channel.
SAS Training: Just a Click Away
Ready to level-up your skills? Choose your own adventure.
-
2 replies
-
05-21-2013 11:47 PM
-
1356 views
-
1 like
-
3 in conversation
-
