- Home
- /
- Programming
- /
- Programming
- /
- how to repeatedly run regression for larger sets
- RSS Feed
- Mark Topic as New
- Mark Topic as Read
- Float this Topic for Current User
- Bookmark
- Subscribe
- Mute
- Printer Friendly Page

- Mark as New
- Bookmark
- Subscribe
- Mute
- RSS Feed
- Permalink
- Report Inappropriate Content
I have a file with 100 coloumns(each column is stock data for 5 years). I have to run OLS between every 2 stocks(proc reg with model statement), so output is going to be coefficients for 4950 (100*99/2) pair of stocks.
I can put proc reg in macro, but I have to call it 4950 times..or I can use matlab (with for loops) to make it less tedious.
Is there a better solution of doing this in SAS (besides macros). thank you
Accepted Solutions

- Mark as New
- Bookmark
- Subscribe
- Mute
- RSS Feed
- Permalink
- Report Inappropriate Content
Two ways of looping in SAS - BY statements or macro.
You could modify the dataset so that you only have two variables and using a by statement, but a macro seems simpler.
Or you can use Matlab or Octave with your for loops.

- Mark as New
- Bookmark
- Subscribe
- Mute
- RSS Feed
- Permalink
- Report Inappropriate Content
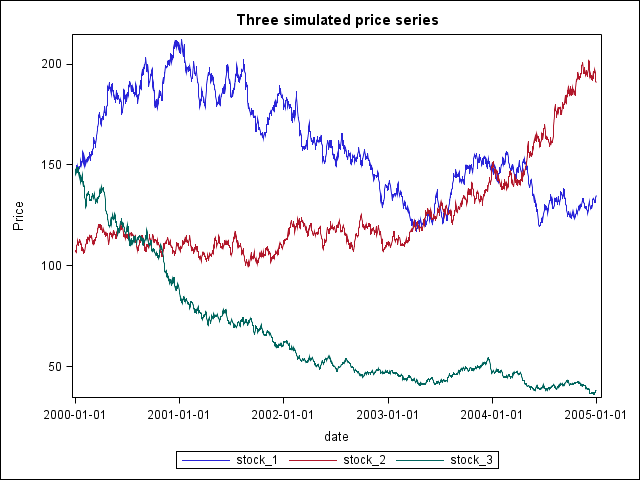
I am no economist or financial expert but the following simulation should warn you of a potential problem when looking for linear relationships between autocorrelated time series :
/* Generate 100 simulated daily price series */
data test;
format date yymmdd10. price 7.2;
call streaminit(658487);
do stock = 1 to 100;
price = 50 + 100 * rand('UNIFORM');
do date = '01jan2000'd to '31dec2004'd;
price = price * (1 + rand("NORMAL", 0.0, 0.01));
output;
end;
end;
run;
proc sort data=test; by date stock; run;
/* Make each simulated stock series into a table column */
proc transpose data=test out=table prefix=stock_;
by date;
id stock;
var price;
run;
/* Plot the first three series */
title "Three simulated price series";
ods graphics / antialiasmax=2000;
proc sgplot data=table;
series x=date y=stock_1 /lineattrs=(pattern=1);
series x=date y=stock_2 /lineattrs=(pattern=1);
series x=date y=stock_3 /lineattrs=(pattern=1);
xaxis type=time tickvalueformat=yymmdd10.;
yaxis label="Price";
run;
/* Find the 5 best correlations for each series */
ods listing select none;
proc corr data=table best=5 Pearson;
var stock_:;
ods output PearsonCorr=PC;
run;
ods listing select all;
options linesize=132;
title "Best correlated price series";
proc print data=PC(drop=best1 R1 P1) noobs; run;
You will notice that far too many relations appear as highly significant among these totally unrelated time series. Looking at the plot should give you a feeling why this happens.
PG
- Mark as New
- Bookmark
- Subscribe
- Mute
- RSS Feed
- Permalink
- Report Inappropriate Content
Two ways of looping in SAS - BY statements or macro.
You could modify the dataset so that you only have two variables and using a by statement, but a macro seems simpler.
Or you can use Matlab or Octave with your for loops.
.jpg")
Catch up on SAS Innovate 2026
Nearly 200 sessions are now available on demand with the SAS Innovate Digital Pass.
Explore Now →Learn how use the CAT functions in SAS to join values from multiple variables into a single value.

Find more tutorials on the SAS Users YouTube channel.
SAS Training: Just a Click Away
Ready to level-up your skills? Choose your own adventure.
-
2 replies
-
03-15-2013 07:25 PM
-
1919 views
-
3 likes
-
3 in conversation
-
