- Home
- /
- Programming
- /
- Programming
- /
- gbarline
- RSS Feed
- Mark Topic as New
- Mark Topic as Read
- Float this Topic for Current User
- Bookmark
- Subscribe
- Mute
- Printer Friendly Page
- Mark as New
- Bookmark
- Subscribe
- Mute
- RSS Feed
- Permalink
- Report Inappropriate Content
Hi ,
when using gbarline , the legend of bar and the legend of plot are getting displayed one above the other below the X-axis.. How do I display them horizontally in the same line just below the X-axis?
they are getting displayed like:
Legend_bar
Legend_line
And i wanted to get them displayed as:
Legend_bar Legend_line
Thanks
- Mark as New
- Bookmark
- Subscribe
- Mute
- RSS Feed
- Permalink
- Report Inappropriate Content
The Bar and Plot statements allow use of separate LEGEND references. In the LEGEND definition there are options for location.
You may be looking at:
legend1 position=(bottom left outside);
legend2 position=(bottom right outside);
and add
legend=legend1 to the options for BAR
legend=legend2 to the options for the first plot statement.
- Mark as New
- Bookmark
- Subscribe
- Mute
- RSS Feed
- Permalink
- Report Inappropriate Content
I tried ur suggestion with the code which is below:
---------- -------------------------
data gbarline_ex;
input x1 $5. y1 y2;
cards;
rang1 1000 1
rang2 2000 2
rang3 3000 3
rang4 4000 4
rang5 5000 5
rang6 6000 6
;
run;
symbol1 v=dot i=join c=red h=0.5 l=1;
legend1 label=none position=(bottom left outside);
legend2 label=none position=(bottom right outside);
axis1 label=none;
axis2 label=none;
proc gbarline data=gbarline_ex;
bar x1 / discrete sumvar=y1 raxis=axis1 legend=legend1;
plot /sumvar=y2 axis=axis2 legend=legend2;
run;
----------------------------------- ---------------
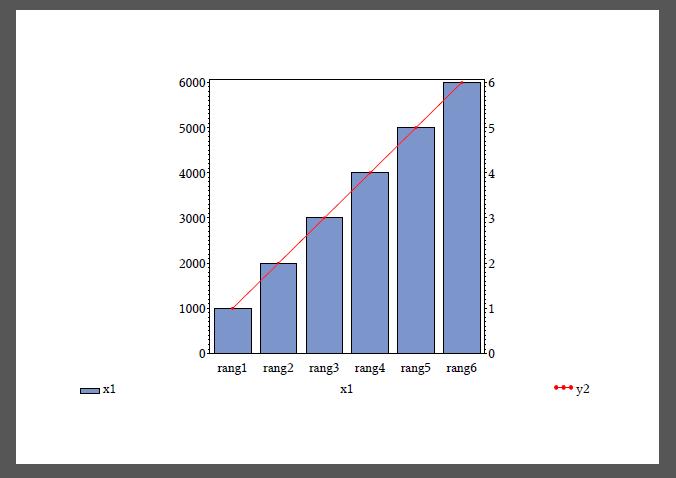
but the legends are going extreme left and extreme right....and not getting displayed below the X-axis.
here is the output :
Also any idea why the blue legend is showing label as X1 , it should be Y1 ...right?
Please suggest...

- Mark as New
- Bookmark
- Subscribe
- Mute
- RSS Feed
- Permalink
- Report Inappropriate Content
Remove the OUTSIDE part of the position then.
The Legend is associated with the BAR or PLOT variable. X1 is your BAR variable and the position for legend1 says to position on the left side of the chart. If you want the Y2 on the left then switch the RIGHT and LEFT in the legend positions.
- Mark as New
- Bookmark
- Subscribe
- Mute
- RSS Feed
- Permalink
- Report Inappropriate Content
I removed "outside" still getting both the legends on the extreme end. Also tried switching RIGHT and LEFT as suggested ..but no success.
- Mark as New
- Bookmark
- Subscribe
- Mute
- RSS Feed
- Permalink
- Report Inappropriate Content
Hello
I am also having this problem. I found your post in the discussion forum, although I can see it was from a long time ago.
Did you manage to find a solution?
George
Learn how use the CAT functions in SAS to join values from multiple variables into a single value.
Find more tutorials on the SAS Users YouTube channel.
SAS Training: Just a Click Away
Ready to level-up your skills? Choose your own adventure.


