- Home
- /
- Programming
- /
- Programming
- /
- Re: cluster analysis [how to improve your question]
- RSS Feed
- Mark Topic as New
- Mark Topic as Read
- Float this Topic for Current User
- Bookmark
- Subscribe
- Mute
- Printer Friendly Page
- Mark as New
- Bookmark
- Subscribe
- Mute
- RSS Feed
- Permalink
- Report Inappropriate Content
hello, could anyone help me with an example of Proc for cluster analysis with graph plot Error?
- Mark as New
- Bookmark
- Subscribe
- Mute
- RSS Feed
- Permalink
- Report Inappropriate Content
Hello @EloarL,
Your question requires more details before experts can help. Can you revise your question to include more information?
Review this checklist:
- Specify a meaningful subject line for your topic. Avoid generic subjects like "need help," "SAS query," or "urgent."
- When appropriate, provide sample data in text or DATA step format. See this article for one method you can use.
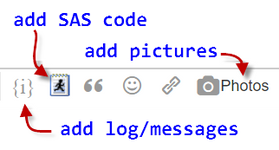
- If you're encountering an error in SAS, include the SAS log or a screenshot of the error condition. Use the Photos button to include the image in your message.
- It also helps to include an example (table or picture) of the result that you're trying to achieve.
To edit your original message, select the "blue gear" icon at the top of the message and select Edit Message. From there you can adjust the title and add more details to the body of the message. Or, simply reply to this message with any additional information you can supply.
SAS experts are eager to help -- help them by providing as much detail as you can.
This prewritten response was triggered for you by fellow SAS Support Communities member @Rick_SAS
.- Mark as New
- Bookmark
- Subscribe
- Mute
- RSS Feed
- Permalink
- Report Inappropriate Content
- Mark as New
- Bookmark
- Subscribe
- Mute
- RSS Feed
- Permalink
- Report Inappropriate Content
Did you try PROC CLUSTER? The examples in the documentation is pretty straightforward:
@EloarL wrote:
I need to generate a cluster analysis in SAS Guide using the K means and centroids method and plot the elbow graph. However I need the help or example of some Proc in this regard.
- Mark as New
- Bookmark
- Subscribe
- Mute
- RSS Feed
- Permalink
- Report Inappropriate Content
yes, i tested them all but i didn't get any results i need because i need a Procesar with a cluster parsing function in R language.
Code used in the R language was as follows:
erro = 0
for (i in 2:20){
erro[i] <- ml_compute_cost(
ml_kmeans(
variaveis_clusters_tratado, CODCLI ~ ., k=i), variaveis_clusters_tratado)
}
plot(erro)
I need a function similar to this in SAS GUIDE
- Mark as New
- Bookmark
- Subscribe
- Mute
- RSS Feed
- Permalink
- Report Inappropriate Content
Can you explain what the R code does? Most of us don't understand R.
Paige Miller
- Mark as New
- Bookmark
- Subscribe
- Mute
- RSS Feed
- Permalink
- Report Inappropriate Content
How to do this in SAS GUIDE?
- Mark as New
- Bookmark
- Subscribe
- Mute
- RSS Feed
- Permalink
- Report Inappropriate Content
- Mark as New
- Bookmark
- Subscribe
- Mute
- RSS Feed
- Permalink
- Report Inappropriate Content
Certainly, SAS can do K-means clustering, its in PROC FASTCLUS.
If that doesn't do what you want, please describe in detail exactly what you need, give us a complete description of what you need, starting from the beginning; instead of making us ask question after question as we have been doing to get this far.
Paige Miller
Learn how use the CAT functions in SAS to join values from multiple variables into a single value.
Find more tutorials on the SAS Users YouTube channel.
SAS Training: Just a Click Away
Ready to level-up your skills? Choose your own adventure.


