- Home
- /
- Programming
- /
- Programming
- /
- Re: annotate help
- RSS Feed
- Mark Topic as New
- Mark Topic as Read
- Float this Topic for Current User
- Bookmark
- Subscribe
- Mute
- Printer Friendly Page
- Mark as New
- Bookmark
- Subscribe
- Mute
- RSS Feed
- Permalink
- Report Inappropriate Content
Hi ,
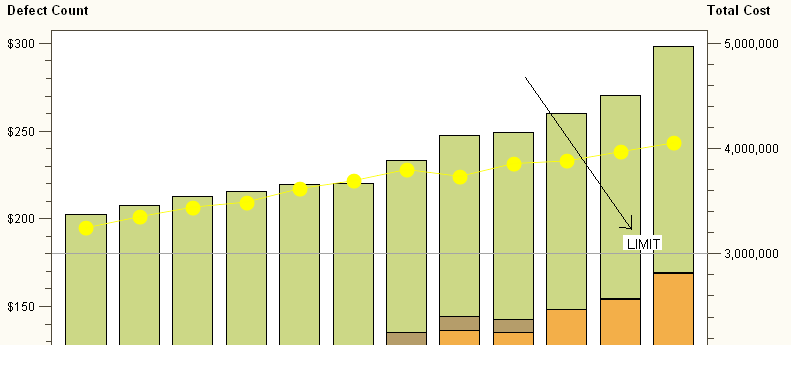
In the below graph which is drawn using gbarline, is it possible to add a text on the graph region shown by arrow.
I am able to draw a reference line using ref option. But not able to add a text above it.
I created below annotate dataset and used it against PLOT statement(of gbarline ) but it says Annotate not supported by PLOT...
Then I used it against BAR statement but it doesn't work.
data an1;
length function color text $ 30 style $ 20;
hsys='3'; when='a';
function = 'move'; xsys='1'; x=0; ysys='2'; y=3000000; output;
function = 'draw'; xsys='1'; x=100; ysys='2'; y=3000000; line=33; size=2;color="gray"; output;
function = 'label'; xsys='1'; x=75; ysys='2'; y=3000000; style="Arial"; size=2; text='Limit'; position="2"; output;
run;
proc gbarline data=sashelp.electric;
bar year / discrete sumvar=Revenue subgroup=Customer
html=revtip name="US_Electric_Power"
des="Chart of US Electricity Generation Sources and Consumers";
plot / sumvar=AllPower html=alltip ref=3000000;
run;
Could someone help me please.!!.(here the reference line and hence the text depend only on the plot response axis and not the bar response axis. so dont want to interchange..)

- Mark as New
- Bookmark
- Subscribe
- Mute
- RSS Feed
- Permalink
- Report Inappropriate Content
Hopefully Robert or anyone more versed in graphics than me will respond. However, I think your coordinates are off and annotate can be included. The following does do exactly what you asked for, but shows that you are on the right track:
data an1;
length function color text $ 30 style $ 20;
hsys='3'; when='a';
function = 'move'; xsys='1'; x=70; ysys='2'; y=280; output;
function = 'draw'; xsys='1'; x=90; ysys='2'; y=180; line=1; size=1;color="gray"; output;
function = 'label'; xsys='1'; x=90; ysys='2';y=180; style="Arial"; size=2; text='Limit'; position="2"; output;
run;
proc gbarline data=sashelp.electric
annotate=an1;
bar year / discrete sumvar=Revenue subgroup=Customer
html=revtip name="US_Electric_Power"
des="Chart of US Electricity Generation Sources and Consumers";
plot / sumvar=AllPower html=alltip ref=3000000;
run;
- Mark as New
- Bookmark
- Subscribe
- Mute
- RSS Feed
- Permalink
- Report Inappropriate Content
Thanks Arthur for your reply.
Actually the reference line needs to be drawn from 3000000.
In the diagram shown, 3000000(of plot response axis) corresponds to 180(of bar response axis) , but in actuality 3000000 can correspond to any value.... since ref line text needs to be along 3000000( so 3000000 is fixed)..hence I tried hardcoding y=3000000 ...
Does y variable (in annotate) always refers to LEFT Y-axis.... , how can we make it refer to the RIGHT Y-Axis(in this case the PLOT Response Axis)
i even tried y1=3000000 , y2=3000000 it doesn't work.......
- Mark as New
- Bookmark
- Subscribe
- Mute
- RSS Feed
- Permalink
- Report Inappropriate Content
Will YAXIS= “Y2” work?
- Mark as New
- Bookmark
- Subscribe
- Mute
- RSS Feed
- Permalink
- Report Inappropriate Content
You may want to look into Graph Template Language as there are some additional features such as this available. The GTL REFERENCELINE statement allows labeling a reference line, controlling the font and color of text and some minimal control over where in relation to the line the label will appear.
Learn how use the CAT functions in SAS to join values from multiple variables into a single value.
Find more tutorials on the SAS Users YouTube channel.
SAS Training: Just a Click Away
Ready to level-up your skills? Choose your own adventure.


