- Home
- /
- Programming
- /
- Programming
- /
- Re: TROUBLE GETTING PROPER BREAK IN PROC REPORT
- RSS Feed
- Mark Topic as New
- Mark Topic as Read
- Float this Topic for Current User
- Bookmark
- Subscribe
- Mute
- Printer Friendly Page
- Mark as New
- Bookmark
- Subscribe
- Mute
- RSS Feed
- Permalink
- Report Inappropriate Content
Hi Community,
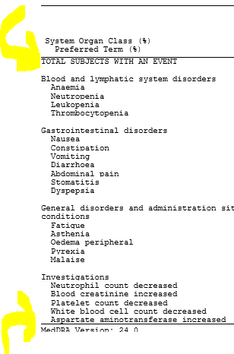
I'm trying to get a proper break (blank rows) between each group and at start and end of the table body, however later part is not working with my current setting of logic. Alongside, blank rows in between each AEBODSYS, I also want to see spaces at highlighted points.
The data ( variable used to get the spaces is grpxSort2) as shown here: However, with current SAS logic, I'm not able to get the proper formatting. Any suggesting please? Thanks in advance.
- Mark as New
- Bookmark
- Subscribe
- Mute
- RSS Feed
- Permalink
- Report Inappropriate Content
- Mark as New
- Bookmark
- Subscribe
- Mute
- RSS Feed
- Permalink
- Report Inappropriate Content
You need to GROUP your grpxsort2variable in the define statement.
define grpxsort2/ group noprint;
- Mark as New
- Bookmark
- Subscribe
- Mute
- RSS Feed
- Permalink
- Report Inappropriate Content
- Mark as New
- Bookmark
- Subscribe
- Mute
- RSS Feed
- Permalink
- Report Inappropriate Content
If you want a working solution you need to provide:
1) actual data in the form of data step code so we have something besides a picture to test code with
2) the complete proc report code you are attempting. Simple things like the order of variables on a columns statement have a big impact on the behavior of proc report not to mention any other proc options. Code should be TEXT. I am afraid that very few of us are going to retype significant elements from a picture. It should be easier to copy code from the editor, or log results, and then paste the copied text into a text box opened on the forum using the </> icon that appears above the message window than to make a picture and attach that.
3) an actual description of the desired formatting. I am not sure exactly what you are expecting. I am afraid that pictures and arrows don't quite tell us if something appears BEFORE or AFTER a value or what the actual conditions based on the data may be.
Also the LOG often includes clues about when the procedure is overriding a syntax issue or incorrect use of an option. So an example log
- Mark as New
- Bookmark
- Subscribe
- Mute
- RSS Feed
- Permalink
- Report Inappropriate Content
If you only need lines on the top and the bottom of your report, try to group also grpxsort1 variable, and add another compute block to add a line before, that's something like this:
data have;
infile cards dsd;
	length ae $25;
	input grp1 grp2 ae $;
	cards;
1, 0, List of AE by group
1, 1, Group 1 Disorders
1, 1, Nausea
1, 1, Anaemia
1, 1, Vomiting
1, 2, Group 2 Disorders
1, 2, Pyrexia
1, 2, Fatigue
1, 2, Malaise
;
proc print;run;

ods rtf file= "&lib\have.rtf";
proc report data=have ;
	column grp1 grp2 ae;
	define grp1/ group noprint;
	define grp2/ group noprint;
	define ae/ 'Adverse Events' display;
	compute before grp1;
		line @1 "";
	endcomp;
	compute after grp2;
		line @1 "";
	endcomp;
run;
ods rtf close;
Output:
Style attributes could be added to apply a desired indentation and format.
- Mark as New
- Bookmark
- Subscribe
- Mute
- RSS Feed
- Permalink
- Report Inappropriate Content
line " ";
endcomp;
compute after ;
line " ";
endcomp;
Learn how use the CAT functions in SAS to join values from multiple variables into a single value.
Find more tutorials on the SAS Users YouTube channel.
SAS Training: Just a Click Away
Ready to level-up your skills? Choose your own adventure.


