- Home
- /
- Programming
- /
- Programming
- /
- Re: How to produce a customized table? customized column? Table sampl...
- RSS Feed
- Mark Topic as New
- Mark Topic as Read
- Float this Topic for Current User
- Bookmark
- Subscribe
- Mute
- Printer Friendly Page

- Mark as New
- Bookmark
- Subscribe
- Mute
- RSS Feed
- Permalink
- Report Inappropriate Content
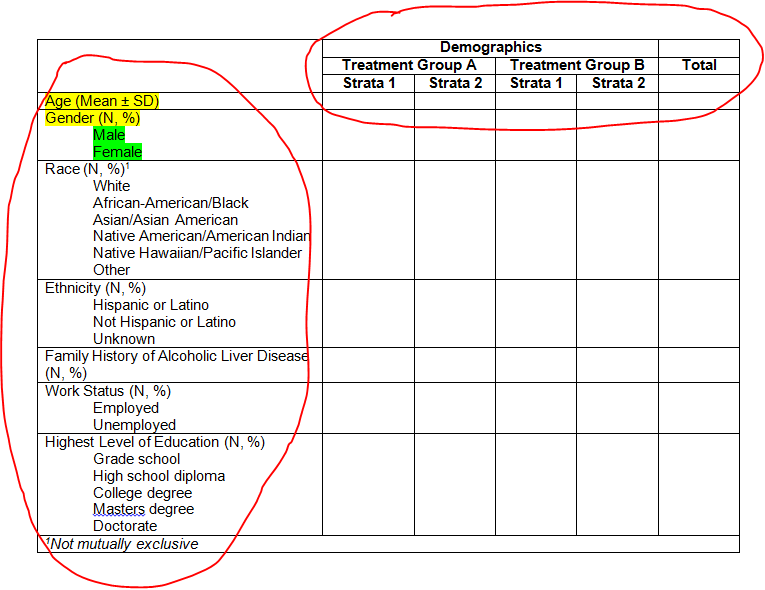
I want to create a table as below. But I have difficulties to make it look exactly same as the sample below.
First, how to make the first column? It lists the variable name first, from the left, then lists the categories for this variable but a little space from the left. For example, Gender (N, %) first and from the very left, then Male, Female following next but a little space from left?
Second, how to make the headers looks like this, first line Demographics, then second line Treatment Group A, Treatment Group B, third line Strata 1, 2, 1, 2....
I really have no idea how to make it. Thanks in advance~

- Mark as New
- Bookmark
- Subscribe
- Mute
- RSS Feed
- Permalink
- Report Inappropriate Content
The trick is getting your data in the right format. Then you can use proc report to generate the table either directly to a word or PDF file.
See this paper for starters.
- Mark as New
- Bookmark
- Subscribe
- Mute
- RSS Feed
- Permalink
- Report Inappropriate Content
Thanks very much~
.jpg")
Catch up on SAS Innovate 2026
Nearly 200 sessions are now available on demand with the SAS Innovate Digital Pass.
Explore Now →Learn how use the CAT functions in SAS to join values from multiple variables into a single value.

Find more tutorials on the SAS Users YouTube channel.
SAS Training: Just a Click Away
Ready to level-up your skills? Choose your own adventure.
-
2 replies
-
05-16-2014 01:36 PM
-
1449 views
-
0 likes
-
2 in conversation
-
