- Home
- /
- Programming
- /
- Programming
- /
- Re: How to arrange many plots in a graph with GTL?
- RSS Feed
- Mark Topic as New
- Mark Topic as Read
- Float this Topic for Current User
- Bookmark
- Subscribe
- Mute
- Printer Friendly Page

- Mark as New
- Bookmark
- Subscribe
- Mute
- RSS Feed
- Permalink
- Report Inappropriate Content
My dataset contains 5 variables ( + 1 variable for patien_ID in a wide format or 1 variable with 5 values in a long format).
I want to draw a graph like the following for each of these 5 variables/values:
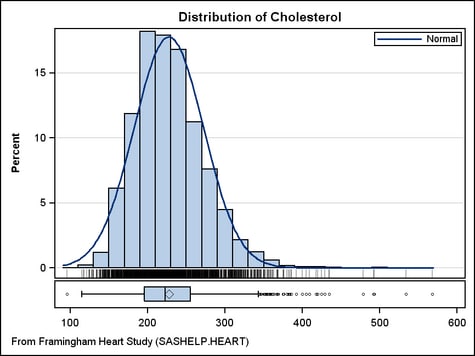
(from the bottom of the page at
I tried to use PROC DATAPANEL and PROC DATALATTICE or PROC LATTICE
but I'm faced errors about the incompatibility of the plots or uggly arrangement of soome but not all plots.
How to overcome the issue?

- Mark as New
- Bookmark
- Subscribe
- Mute
- RSS Feed
- Permalink
- Report Inappropriate Content
Best to post what you attempted and any error log messages.
- Mark as New
- Bookmark
- Subscribe
- Mute
- RSS Feed
- Permalink
- Report Inappropriate Content
My code is:
DATA my_data;
INPUT IDN AA BB CC DD EE;
CARDS;
1 44.00 23.00 17.00 23.00 29.00
2 32.00 40.00 51.00 37.00 10.00
3 26.00 47.00 43.00 21.00 52.00
4 41.00 46.00 39.00 55.00 7.00
5 25.00 6.00 50.00 53.00 44.00
6 52.00 52.00 9.00 45.00 49.00
7 51.00 49.00 20.00 32.00 41.00
8 23.00 27.00 31.00 50.00 24.00
;
RUN;
PROC TEMPLATE;
DEFINE STATGRAPH combined.plot;
BEGINGRAPH;
ENTRYTITLE "Distribution of AA";
LAYOUT LATTICE /
COLUMNS = 1
COLUMNGUTTER = 2 px
ROWGUTTER = 20 px
COLUMNDATARANGE = UNIONALL
ORDER = COLUMNMAJOR
ROWDATARANGE = UNIONALL
SKIPEMPTYCELLS = TRUE;
/*THE UPPER PLOT*/
LAYOUT OVERLAY /
YAXISOPTS = (
OFFSETMIN = 0.05
GRIDDISPLAY = AUTO_ON);
HISTOGRAM AA /
SCALE = PERCENT
BINAXIS = FALSE
DATATRANSPARENCY = 0.4;
DENSITYPLOT AA /
NORMAL( )
NAME = "NORM"
LEGENDLABEL = "NORMAL"
LINEATTRS = GRAPHDATA2 (THICKNESS = 1 px COLOR = BLACK);
DENSITYPLOT AA /
KERNEL( )
NAME = "KERN"
LEGENDLABEL = "KERNEL"
LINEATTRS = GRAPHDATA2 (THICKNESS = 1 px COLOR = RED);
FRINGEPLOT AA /
DATATRANSPARENCY = 0
FRINGEHEIGHT = 7 px;
ENDLAYOUT;
/*THE LOW PLOT*/
LAYOUT OVERLAY /
YAXISOPTS = (
GRIDDISPLAY= ON
DISPLAY = (TICKS TICKVALUES));
BANDPLOT Y = AA
LIMITLOWER = EVAL(LCLM(AA))
LIMITUPPER = EVAL(UCLM(AA)) /
XAXIS = X
EXTEND = TRUE
DISPLAY = (FILL)
FILLATTRS = GRAPHCONFIDENCE2
NAME = "BAND"
LEGENDLABEL = "95% CONFIDENCE";
BOXPLOT Y = AA /
ORIENT = horizontal
BOXWIDTH = 0.9
DATATRANSPARENCY = 0.5
YAXIS = Y2;
ENDLAYOUT;
ENDLAYOUT;
ENDGRAPH;
END;
TITLE "AA Distribution (normal) with proc_TEMPLATE";
RUN;
PROC SGRENDER DATA = my_data TEMPLATE = combined.plot ;
RUN;
I want to make these two plots to be located one below the other, but I can't manage it.
Also it would be nice to produce such combined plots for all variables in a data set without copying these lines for all variable names. How to do it?
(May be I should use stacked/long-format data set?
Thank you in advance.
- Mark as New
- Bookmark
- Subscribe
- Mute
- RSS Feed
- Permalink
- Report Inappropriate Content
Add Rows=2 after columns=1. The proportions may not look quite as you would like but they are one over the other. You may need to use other options to get the display area more to your needs as I think the default isn't very nice.
An example for using dynamic variables, which is what you want, has an example in the online help named
GSGREND1-Defining Dynamic Variables
under SAMPLES for SAS/Graph.
Basically you add a statement at the top of your template DYNAMIC <LIST OF VARIABLE NAMES>;
Then define your graphic elements in terms of those variables. Then in your SGRENDER code you add a line that links your data variables to the dynamic ones in the template.
Your final data call would look like one call to SGRENDER for each of those variables you wanted to process the same with the changes being to dataset (if other data set is needed) and the dynamic link.
I hope this helps.
- Mark as New
- Bookmark
- Subscribe
- Mute
- RSS Feed
- Permalink
- Report Inappropriate Content
I deleted the following lines:
LAYOUT LATTICE /
COLUMNS = 1
COLUMNGUTTER = 2 px
ROWGUTTER = 20 px
COLUMNDATARANGE = UNIONALL
ORDER = COLUMNMAJOR
ROWDATARANGE = UNIONALL
SKIPEMPTYCELLS = TRUE;
And managed with the DYNAMIC (thanks, ballardw ![]() ). Now I have 5 double plots. But I wanna to have them in 1 mega chart
). Now I have 5 double plots. But I wanna to have them in 1 mega chart ![]() . I've tried with ROWS and COLUMNS but failed...
. I've tried with ROWS and COLUMNS but failed...
- Mark as New
- Bookmark
- Subscribe
- Mute
- RSS Feed
- Permalink
- Report Inappropriate Content
At last I achieved the following result ![]() :
:
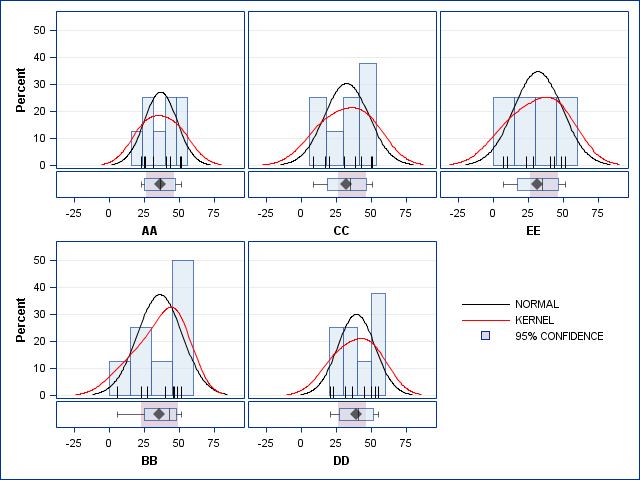
But in general I used the lines as in my post from Aug 1, 2012 5:25 AM for each 'XX' cell. How can I reduce the number of lines?
(With DYNAMIC I get 5 different plots with messy combination of them...)
The other questions:
- I draw the graph as a tool for checking normality. But also I want to compare the data with beta, gamma, lognormal distributions. How to generate different graphs with the named curves (i.e. to draw 3 graphs additionally)? With DYNAMIC?
- How to consider A4 paper for graphics output in SAS?
Can anybody help me?
- Mark as New
- Bookmark
- Subscribe
- Mute
- RSS Feed
- Permalink
- Report Inappropriate Content
Without an example of what you want your final output to look like I haven't a clue on combining the different distributions as there are likely to be many ways.
The ODS GRAPHICS will let you set options such as width and height of the graph(s) created. note that in the case of multiple graphs as you're showing the size is for the combined group, that may allow you to get the desired appearance on A4. You may need to generate either an RTF or PDF document to get the control you need as HTML in general doesn't recognize paper limits.
.jpg")
Catch up on SAS Innovate 2026
Nearly 200 sessions are now available on demand with the SAS Innovate Digital Pass.
Explore Now →Learn how use the CAT functions in SAS to join values from multiple variables into a single value.

Find more tutorials on the SAS Users YouTube channel.
SAS Training: Just a Click Away
Ready to level-up your skills? Choose your own adventure.
-
6 replies
-
07-27-2012 10:37 AM
-
3126 views
-
3 likes
-
2 in conversation
-
