- Home
- /
- Programming
- /
- Programming
- /
- Days since 52 week high
- RSS Feed
- Mark Topic as New
- Mark Topic as Read
- Float this Topic for Current User
- Bookmark
- Subscribe
- Mute
- Printer Friendly Page

- Mark as New
- Bookmark
- Subscribe
- Mute
- RSS Feed
- Permalink
- Report Inappropriate Content
Hi,
We managed to work out how to calculate 52 week highs from daily stock market data.
However we also need to work out how many days since the last 52 week high.
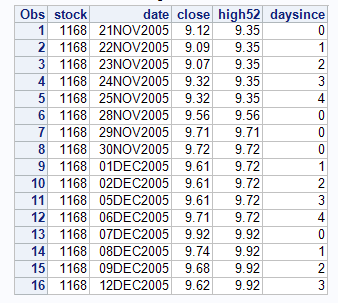
Our data looks like this. It is 9m records so a little computationally intensive.
| 1168 | 21NOV2005 | 9.12 | 9.35 |
| 1168 | 22NOV2005 | 9.09 | 9.35 |
| 1168 | 23NOV2005 | 9.07 | 9.35 |
| 1168 | 24NOV2005 | 9.32 | 9.35 |
| 1168 | 25NOV2005 | 9.32 | 9.35 |
| 1168 | 28NOV2005 | 9.56 | 9.56 |
| 1168 | 29NOV2005 | 9.71 | 9.71 |
| 1168 | 30NOV2005 | 9.72 | 9.72 |
| 1168 | 01DEC2005 | 9.61 | 9.72 |
| 1168 | 02DEC2005 | 9.61 | 9.72 |
| 1168 | 05DEC2005 | 9.61 | 9.72 |
| 1168 | 06DEC2005 | 9.71 | 9.72 |
| 1168 | 07DEC2005 | 9.92 | 9.92 |
| 1168 | 08DEC2005 | 9.74 | 9.92 |
| 1168 | 09DEC2005 | 9.68 | 9.92 |
| 1168 | 12DEC2005 | 9.62 | 9.92 |
For example, on 6th December, the days since the last 52 week high would be 4.
We need this for every date.
Note that there will also been days with missing data i.e. no trade occurred.
Many thanks for any assistance or direction!
Accepted Solutions

- Mark as New
- Bookmark
- Subscribe
- Mute
- RSS Feed
- Permalink
- Report Inappropriate Content
Perhaps adding NOTSORTED would work. Sample data should be included.

- Mark as New
- Bookmark
- Subscribe
- Mute
- RSS Feed
- Permalink
- Report Inappropriate Content
I'm not sure if this is what you are looking for but at least there is some direction. I assumed 52 weeks as 365 days.
And I'm not sure what do you want for those days which are current year's highs.
data have;
attrib date format=date9. informat=date9.;
infile cards dlm=' ';
input stock date dailylow dailyhigh;
cards;
1168 21NOV2005 9.12 9.35
1168 22NOV2005 9.09 9.35
1168 23NOV2005 9.07 9.35
1168 24NOV2005 9.32 9.35
1168 25NOV2005 9.32 9.35
1168 28NOV2005 9.56 9.56
1168 29NOV2005 9.71 9.71
1168 30NOV2005 9.72 9.72
1168 01DEC2005 9.61 9.72
1168 02DEC2005 9.61 9.72
1168 05DEC2005 9.61 9.72
1168 06DEC2005 9.71 9.72
1168 07DEC2005 9.92 9.92
1168 08DEC2005 9.74 9.92
1168 09DEC2005 9.68 9.92
1168 12DEC2005 9.62 9.92
;
run;
proc sql;
create table have2 as
select *, monotonic() as obs
from have;
quit;
proc sql;
create table want as
select h1.stock, h1.date, h1.dailylow, h1.dailyhigh, coalesce(h1.obs-h2.obs,0) as days_since, h2.date as highdate, h2.dailylow as highdailylow, h2.dailyhigh as highdailyhigh
from have2 h1
left join have2 h2
on h1.stock = h2.stock
and h1.date gt h2.date
and h1.date lt h2.date+365
and h2.dailylow ge h1.dailylow
group by h1.stock, h1.date
having h2.dailylow = max(h2.dailylow) ;
quit;

- Mark as New
- Bookmark
- Subscribe
- Mute
- RSS Feed
- Permalink
- Report Inappropriate Content
For your purpose you probably want to replace '06DEC2005'd with today() or another date field but I think this will work for your purposes:
data want;
set have;
format high_date date9.;
retain high_date;
if dailyhigh = dailylow then high_date = date;
diff_date = '06DEC2005'd - high_date;
run;
- Mark as New
- Bookmark
- Subscribe
- Mute
- RSS Feed
- Permalink
- Report Inappropriate Content
Based on your rather sparse description of what you have and what you want.
infile cards expandtabs;
input stock date:Date. close high52;
format date date9.;
cards;
1168 21NOV2005 9.12 9.35
1168 22NOV2005 9.09 9.35
1168 23NOV2005 9.07 9.35
1168 24NOV2005 9.32 9.35
1168 25NOV2005 9.32 9.35
1168 28NOV2005 9.56 9.56
1168 29NOV2005 9.71 9.71
1168 30NOV2005 9.72 9.72
1168 01DEC2005 9.61 9.72
1168 02DEC2005 9.61 9.72
1168 05DEC2005 9.61 9.72
1168 06DEC2005 9.71 9.72
1168 07DEC2005 9.92 9.92
1168 08DEC2005 9.74 9.92
1168 09DEC2005 9.68 9.92
1168 12DEC2005 9.62 9.92
;;;;
run;
proc print;
run;
data days;
set stock;
by stock high52;
if first.high52 then daysince=0;
else daysince+1;
run;
proc print;
run;
- Mark as New
- Bookmark
- Subscribe
- Mute
- RSS Feed
- Permalink
- Report Inappropriate Content
Thanks so much data_null_ and sorry for the sparse description
The only problem with this code is that it doesn't like situations where there are duplicate 52 week highs. That is, it has a sorting problem. Any suggestions for this?
- Mark as New
- Bookmark
- Subscribe
- Mute
- RSS Feed
- Permalink
- Report Inappropriate Content
Perhaps adding NOTSORTED would work. Sample data should be included.
- Mark as New
- Bookmark
- Subscribe
- Mute
- RSS Feed
- Permalink
- Report Inappropriate Content
Thanks very much, this solved the problem. Again, thanks for your help!
.jpg")
Catch up on SAS Innovate 2026
Nearly 200 sessions are now available on demand with the SAS Innovate Digital Pass.
Explore Now →Learn how use the CAT functions in SAS to join values from multiple variables into a single value.

Find more tutorials on the SAS Users YouTube channel.
SAS Training: Just a Click Away
Ready to level-up your skills? Choose your own adventure.
-
6 replies
-
06-05-2015 02:13 AM
-
4530 views
-
6 likes
-
4 in conversation
-
