- Home
- /
- Programming
- /
- SAS Procedures
- /
- use proc corr between price and lag of price
- RSS Feed
- Mark Topic as New
- Mark Topic as Read
- Float this Topic for Current User
- Bookmark
- Subscribe
- Mute
- Printer Friendly Page

- Mark as New
- Bookmark
- Subscribe
- Mute
- RSS Feed
- Permalink
- Report Inappropriate Content
Hi, I'm trying to see if a data set (or multiple of them) which are in a data set forma are highly volatile and if they show large variances. So one way I am doing this through is getting the price and it's lag of one month... example below.. the I ran a proc corr between Price and Lag_Price to see if there are highly correlated, if they are, then the difference in price from last month to current month, and so on, are correlated and therefore not a high variance between the 2.... The question I have is, if I have a time series of say 20 months and I get the lag month of that series, 19 months.. and run a proc corr, since I'm only seeing 1 number for the CORRELATION, is this fine ?, or I was hoping to see 19 numbers of correlation between prioce and price_lag for each of the months..
Example
Date Price Lag_Price
Jan 29
Feb 32 29
Mar 40 32
Apr 46 40
May 53 46
Jun 90 53
Jul 92 90
I was hoping to see a high volatility between May and Jun, or even if I use a bY statement for the Cities, if one city is considered highly volatile and another not..
Thanks

- Mark as New
- Bookmark
- Subscribe
- Mute
- RSS Feed
- Permalink
- Report Inappropriate Content
Wrong place. You should be at forum SAS Forecasting .
proc corr is suited for two variables which are independent for each other.
Your data is time series data ,they both are highly correlated .You can't use proc corr.
You should check some other proc( like proc armia ) in SAS/ETS module.
Ksharp

- Mark as New
- Bookmark
- Subscribe
- Mute
- RSS Feed
- Permalink
- Report Inappropriate Content
UPDATE: this author needs more coffee ![]()
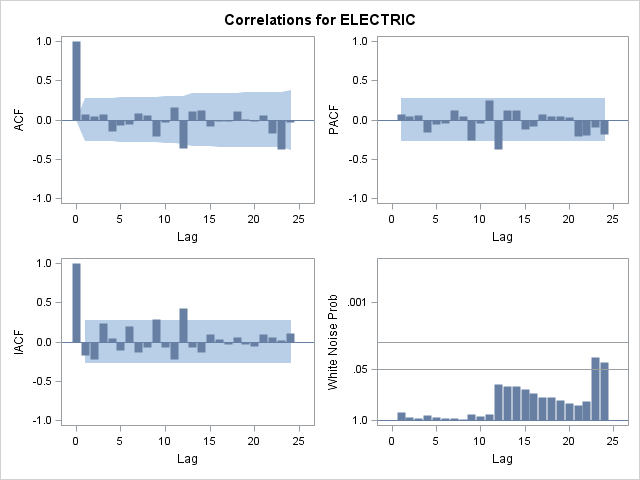
I realized only now that you are actually interested in autocorrelation - since it is only one time series you are looking at.
The good news is that PROC TIMESERIES allows you to analyze autocorrelation as well.
proc timeseries data=sashelp.workers out=_null_ plot=corr;
id date interval=month;
var electric /dif=1 sdif=1;
run;
Hello -
As you are dealing with time series you might want to check out the cross-correlations of your series instead.
The TIMESERIES procedure of SAS/ETS is providing you with access to such analysis.
Remember that in order to make sense out of cross-correlations your series have to be stationary.
Example:
SASHELP.WORKERS contains two monthly time series: ELECTRIC and MASONRY
These variables describe employment of these occupations which are highly seasonal.
Typically, the MASONRY workers build a structure first; then, the ELECTRIC workers wire the structure afterwards.
You would expect that the MASONRY employment would LEAD the ELECTRIC employment.
proc timeseries data=sashelp.workers out=_null_ outcrosscorr=crosscorr crossplot=(series ccf);
id date interval=month;
var electric /dif=1 sdif=1;
crossvar masonry / dif=1 sdif=1;
run;
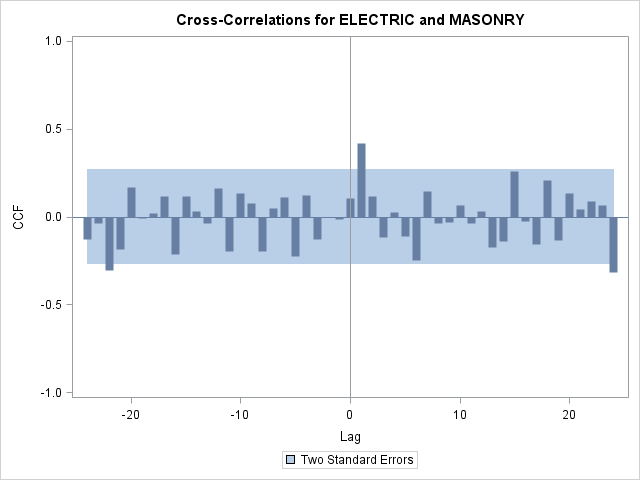
According to this analysis there is a strong correlation at LAG=1 - so we can conclude that MASONRY leads ELECTRIC.
Thanks!
Udo
.jpg")
Catch up on SAS Innovate 2026
Nearly 200 sessions are now available on demand in the Innovate Hub.
Watch Now →Learn the difference between classical and Bayesian statistical approaches and see a few PROC examples to perform Bayesian analysis in this video.

Find more tutorials on the SAS Users YouTube channel.
SAS Training: Just a Click Away
Ready to level-up your skills? Choose your own adventure.
-
2 replies
-
08-16-2012 04:38 PM
-
2760 views
-
0 likes
-
3 in conversation
-
