- Home
- /
- Programming
- /
- SAS Procedures
- /
- Re: rearranging data in sas based on different response
- RSS Feed
- Mark Topic as New
- Mark Topic as Read
- Float this Topic for Current User
- Bookmark
- Subscribe
- Mute
- Printer Friendly Page

- Mark as New
- Bookmark
- Subscribe
- Mute
- RSS Feed
- Permalink
- Report Inappropriate Content
I have a data in sas like:
Category Response
A 50% - 70%
A 0%
A 0%
A More than 70%
B More than 70%
B 1% - 49%
B 0%
B 0%
B 50% -70%
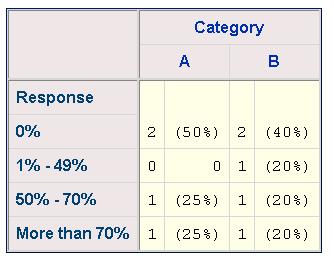
I want my result data to look like:
Response A B
0% 2 (50%) 2 (40%)
1% -49% 0(0%) 1 (20%)
50%- 70% 1 (25%) 1 (20%)
More than 70% 1 (25%) 1 (20%)
Explanation of result data:
There are two categories A (=4)and B (=5) and there are four different types of response 0%, 1% -49%, 50% -70% and more than 70%.
In category A, only two out of four responded 0%, thus result is 2 (50%). Similarly in A, on;y one out of four responded 50-70%, thus result is 1 (25%).
Same as B for each response.
I would be grateful for your time reagarding the same.

- Mark as New
- Bookmark
- Subscribe
- Mute
- RSS Feed
- Permalink
- Report Inappropriate Content
For your situation, I prefer to use proc report.
data temp;
input Category     $     Response & $20.;
cards;
A                         50% - 70%
A                          0%
A                          0%
A                          More than 70%
B                          More than 70%
B                          1% - 49%
B                            0%
B                             0%
B                           50% - 70%
;
run;
options missing=0;
proc report data=temp nowd out=x;
 column response category,(n pctn cate);
 define response/group;
 define category/across ' ';
 define n/noprint ;
 define pctn/ noprint;
 define cate/computed ' ';
 compute cate /char length=10;
  _c4_=cats(_c2_,'(',_c3_*100,'%)');
  _c7_=cats(_c5_,'(',_c6_*100,'%)');
 endcomp;
run;
Ksharp

- Mark as New
- Bookmark
- Subscribe
- Mute
- RSS Feed
- Permalink
- Report Inappropriate Content
Thanks to KSharp's idea of using PROC REPORT. Here is one more solution using PROC TABULATE.
PROC FORMAT;
PICTURE MYPCT LOW-HIGH = '009%)' (PREFIX="(");
RUN;
OPTIONS MISSING=0;
PROC TABULATE DATA = DSN;
CLASS RESPONSE CATEGORY;
TABLE RESPONSE, CATEGORY*(N='' PCTN<RESPONSE>=' ' *F=MYPCT.);
RUN;
Though we are getting the expected output, the 0's are not displaying with % sign. Can some one help on how to display 0 along with % sign.
Thanks
Dhanasekaran R
- Mark as New
- Bookmark
- Subscribe
- Mute
- RSS Feed
- Permalink
- Report Inappropriate Content
My code has already achieved that.
Ksharp
- Mark as New
- Bookmark
- Subscribe
- Mute
- RSS Feed
- Permalink
- Report Inappropriate Content
Yes I understood your solution worked well. But I just tried the same output with PROC TABULATE except the 0 with % sign everything is working fine.
Can you help how to get this 0 with % sign in my solution.
Thanks
Dhanasekarna R
- Mark as New
- Bookmark
- Subscribe
- Mute
- RSS Feed
- Permalink
- Report Inappropriate Content
I am afraid that you need to pre-process your datasets firstly.
That is to say change the missing value into 0 , then use proc tabulate.
Is there someone can use proc tabulate to get it directly?
Ksharp
- Mark as New
- Bookmark
- Subscribe
- Mute
- RSS Feed
- Permalink
- Report Inappropriate Content
It is very interesting. If I used O to instead of zero ,it worked. If you don't mind this.
data temp;
input Category     $     Response & $20.;
cards;
A                         50% - 70%
A                          0%
A                          0%
A                          More than 70%
B                          More than 70%
B                          1% - 49%
B                            0%
B                             0%
B                           50% - 70%
;
run;


PROC FORMAT;

     PICTURE MYPCT LOW-HIGH = '009%)'   (PREFIX="(")
                          . = '(O%)';

RUN;


options missing=O;
PROC TABULATE DATA = temp ;

CLASS RESPONSE CATEGORY;

TABLE RESPONSE, CATEGORY*(N='' PCTN=' ' *F=MYPCT.);

RUN;
Ksharp
- Mark as New
- Bookmark
- Subscribe
- Mute
- RSS Feed
- Permalink
- Report Inappropriate Content
Yes I have got O in place of zero. Thanks Ksharp for your idea. ![]() But that is not an accepted soultion.
But that is not an accepted soultion. ![]() . Does some one have any idea ?
. Does some one have any idea ?
Thanks
Dhanasekaran R
.jpg")
Catch up on SAS Innovate 2026
Nearly 200 sessions are now available on demand with the SAS Innovate Digital Pass.
Explore Now →Learn the difference between classical and Bayesian statistical approaches and see a few PROC examples to perform Bayesian analysis in this video.

Find more tutorials on the SAS Users YouTube channel.
SAS Training: Just a Click Away
Ready to level-up your skills? Choose your own adventure.
-
7 replies
-
09-25-2011 07:27 PM
-
3075 views
-
0 likes
-
3 in conversation
-
