- Home
- /
- Programming
- /
- SAS Procedures
- /
- cumulative percentage plot of event over time (multiple arms)
- RSS Feed
- Mark Topic as New
- Mark Topic as Read
- Float this Topic for Current User
- Bookmark
- Subscribe
- Mute
- Printer Friendly Page
- Mark as New
- Bookmark
- Subscribe
- Mute
- RSS Feed
- Permalink
- Report Inappropriate Content
I want to plot the cumulative percentage of event over time, and have multiple arms, so I want to plot the curves in the single graph.
Time is continuous. event is 0 or 1.
Can anyone recommend an example how to do this?
- Mark as New
- Bookmark
- Subscribe
- Mute
- RSS Feed
- Permalink
- Report Inappropriate Content
Hello @fengyuwuzu,
Your question requires more details before experts can help. Can you revise your question to include more information?
Review this checklist:
- Specify a meaningful subject line for your topic. Avoid generic subjects like "need help," "SAS query," or "urgent."
- When appropriate, provide sample data in text or DATA step format. See this article for one method you can use.
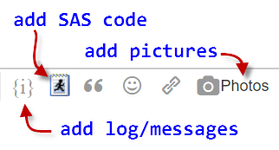
- If you're encountering an error in SAS, include the SAS log or a screenshot of the error condition. Use the Photos button to include the image in your message.
- It also helps to include an example (table or picture) of the result that you're trying to achieve.
To edit your original message, select the "blue gear" icon at the top of the message and select Edit Message. From there you can adjust the title and add more details to the body of the message. Or, simply reply to this message with any additional information you can supply.
SAS experts are eager to help -- help them by providing as much detail as you can.
This prewritten response was triggered for you by fellow SAS Support Communities member @ballardw
.- Mark as New
- Bookmark
- Subscribe
- Mute
- RSS Feed
- Permalink
- Report Inappropriate Content
Example data
Which percentages you want calculated and plotted
The basic plot would be created once the data is summarized assuming you have variable to indicate which "arm" (what ever that may mean) the represents with:
proc sgplot data=want;
series x=time y=percentagevalue/group=arm;
run;
Without seeing the data exactly how to calculate your percentages is problematical though Proc Freq is the first thing that comes to mind to do cumulative percentages of counts.
- Mark as New
- Bookmark
- Subscribe
- Mute
- RSS Feed
- Permalink
- Report Inappropriate Content
data have1;
 input ID $ arm $ event days ;
 datalines;
 001 A 1 10.5
 002 B 1 49.7
 003 A 1 14.5
 004 B 1 28.5
 005 A 1 37.9
 006 B 1 41.7
 007 A 1 18.3
 008 A 1 26.5
 009 A 1 39.3
 010 B 1 51.9
 011 B 1 31.7
 012 A 1 17.4
 013 B 1 25.3
 014 A 1 47.4
 015 A 1 15.7
 016 B 1 34.3
 017 B 1 47.5
 018 A 1 56.1
 019 B 1 27.8
 020 A 1 17.4
 021 B 1 43.3
 022 A 1 52.7
 023 A 1 64.8
 024 B 1 43.3
 025 A 1 52.7
 026 A 1 64.8
 027 B 1 43.3
 028 B 1 52.7
 029 B 1 64.8
 030 A 1 44.9
;
 run;


 data have2;
 input ID $ arm $ event days ;
 datalines;
 001 A 1 10.5
 002 B 1 49.7
 003 A 0 14.5
 004 B 0 28.5
 005 A 1 37.9
 006 B 1 41.7
 007 A 0 18.3
 008 A 1 26.5
 009 A 1 39.3
 010 B 0 51.9
 011 B 1 31.7
 012 A 1 17.4
 013 B 0 25.3
 014 A 0 47.4
 015 A 1 15.7
 016 B 1 34.3
 017 B 1 47.5
 018 A 1 56.1
 019 B 0 27.8
 020 A 0 17.4
 021 B 1 43.3
 022 A 0 52.7
 023 A 1 64.8
 024 B 1 43.3
 025 A 1 52.7
 026 A 0 64.8
 027 B 0 43.3
 028 B 1 52.7
 029 B 0 64.8
 030 A 0 44.9
;
 run;
In data have1, every one has event (event=1);
in data have2, only some have event (event=1)
want to get a plot of cumulative percentage of event in both situation
- Mark as New
- Bookmark
- Subscribe
- Mute
- RSS Feed
- Permalink
- Report Inappropriate Content
Does this do something like what you want for Have1?
proc sort data=have1;
   by arm days;
run;
proc freq data=have1;
   by arm;
   tables days/out=h1freq outcum;
run;

proc sgplot data=h1freq;
   series x=days y=cum_pct/group=arm;
   label cum_pct='Cumulative  Percentage';
run;
If that is close then the main difference for doing have2 would be to include a WHERE event=1; in the Proc freq.
- Mark as New
- Bookmark
- Subscribe
- Mute
- RSS Feed
- Permalink
- Report Inappropriate Content
Thank you very much ballardw.
Yes, for the first one, it is what I want.
I did not know proc freq can be used for continuous variable (in my case the time is continuous).
for the second one, is it possible to include the event=0 in the denominator, so the overall % will not reach 100% in the end?
April 27 – 30 | Gaylord Texan | Grapevine, Texas
Registration is open
Walk in ready to learn. Walk out ready to deliver. This is the data and AI conference you can't afford to miss.
Register now and lock in 2025 pricing—just $495!
Learn the difference between classical and Bayesian statistical approaches and see a few PROC examples to perform Bayesian analysis in this video.
Find more tutorials on the SAS Users YouTube channel.
SAS Training: Just a Click Away
Ready to level-up your skills? Choose your own adventure.


