- Home
- /
- Programming
- /
- SAS Procedures
- /
- Stored Process code to create spark Table
- RSS Feed
- Mark Topic as New
- Mark Topic as Read
- Float this Topic for Current User
- Bookmark
- Subscribe
- Mute
- Printer Friendly Page

- Mark as New
- Bookmark
- Subscribe
- Mute
- RSS Feed
- Permalink
- Report Inappropriate Content
Hi All,
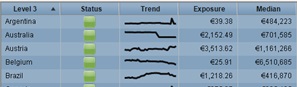
I am having requirement to create spark table using base SAS. I am aware of creating spark line graph using sgplot, but I don need that as I have the requiremnt to create speakline in a table, as I need to show some varibales in the table with sparkline. Please find the screenshot of the expected output below:-
Regards,
Swapna

- Mark as New
- Bookmark
- Subscribe
- Mute
- RSS Feed
- Permalink
- Report Inappropriate Content
Hi:
The general approach to this is to make the separate image files for each country or category. But then. you use a style override in PROC PRINT or PROC REPORT to insert the image into the table.
See these papers by Paul Oldenkamp http://www2.sas.com/proceedings/forum2008/262-2008.pdf and
Louise Hadden and her example http://support.sas.com/resources/papers/proceedings13/212-2013.pdf of a graph in a table on page 9.
I recommend that you get the program working first before you turn this into a stored process.
.cynthia

- Mark as New
- Bookmark
- Subscribe
- Mute
- RSS Feed
- Permalink
- Report Inappropriate Content
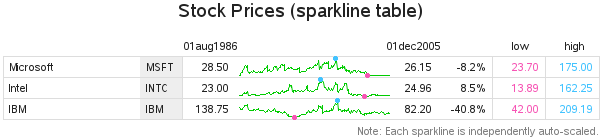
I describe one way to do this in my book "SAS/Graph: Beyond the Basics" (Example 14).
Here is the code used in that example:
http://robslink.com/SAS/book/example14.sas
And here is an example of what the output looks like:
.jpg")
Catch up on SAS Innovate 2026
Nearly 200 sessions are now available on demand in the Innovate Hub.
Watch Now →Learn the difference between classical and Bayesian statistical approaches and see a few PROC examples to perform Bayesian analysis in this video.

Find more tutorials on the SAS Users YouTube channel.
SAS Training: Just a Click Away
Ready to level-up your skills? Choose your own adventure.
-
2 replies
-
06-18-2015 08:09 AM
-
2415 views
-
0 likes
-
3 in conversation
-
