- Home
- /
- Programming
- /
- SAS Procedures
- /
- Re: Retain statement questions
- RSS Feed
- Mark Topic as New
- Mark Topic as Read
- Float this Topic for Current User
- Bookmark
- Subscribe
- Mute
- Printer Friendly Page

- Mark as New
- Bookmark
- Subscribe
- Mute
- RSS Feed
- Permalink
- Report Inappropriate Content
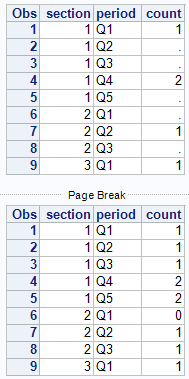
I am looking to convert a table like the one below...
| Section | Period | Count |
|---|---|---|
| 1 | Q1 | 1 |
| 1 | Q2 | . |
| 1 | Q3 | . |
| 1 | Q4 | 2 |
| 1 | Q5 | . |
| 2 | Q1 | . |
| 2 | Q2 | 1 |
| 2 | Q3 | . |
| 3 | Q1 | 1 |
into the following table. So, turn the count into a running total for each section.
| Section | Period | Count |
|---|---|---|
| 1 | Q1 | 1 |
| 1 | Q2 | 1 |
| 1 | Q3 | 1 |
| 1 | Q4 | 2 |
| 1 | Q5 | 2 |
| 2 | Q1 | 0 |
| 2 | Q2 | 1 |
| 2 | Q3 | 1 |
| 3 | Q1 | 1 |
| ... |

- Mark as New
- Bookmark
- Subscribe
- Mute
- RSS Feed
- Permalink
- Report Inappropriate Content
Hi,
Can you provide some test data in the form of a datastep, as your data is before. I don't see why you only have number at certain points. I mean you could do retain, however, why do you only have some numbers, it may be easier to change the way count is added to the dataset rather than retain them afterwards.

- Mark as New
- Bookmark
- Subscribe
- Mute
- RSS Feed
- Permalink
- Report Inappropriate Content
data want (drop=oldcount);
set have (rename=(count=oldcount));
by section;
retain count;
if first.section then count = 0;
if oldcount ne . then count=oldcount;
run;
Edit: Replaced zero with dot in second if condition
Post updated: Kurt Bremser
- Mark as New
- Bookmark
- Subscribe
- Mute
- RSS Feed
- Permalink
- Report Inappropriate Content
Yes, but it still begs the question, what is the count column, how is it arrived at, i.e. why does Q1 have 1 and Q2 not? Also, you can't have a Q5.

- Mark as New
- Bookmark
- Subscribe
- Mute
- RSS Feed
- Permalink
- Report Inappropriate Content
Looks like a common LOCF problem to me.
infile cards expandtabs;
input section period :$2. count;
cards;
1 Q1 1
1 Q2 .
1 Q3 .
1 Q4 2
1 Q5 .
2 Q1 .
2 Q2 1
2 Q3 .
3 Q1 1
;;;;
run;
proc print;
run;
data section;
update section(obs=0 keep=section) section;
by section;
if first.section then count=coalesce(count,0);
output;
run;
proc print;
run;
.jpg")
Catch up on SAS Innovate 2026
Nearly 200 sessions are now available on demand in the Innovate Hub.
Watch Now →Learn the difference between classical and Bayesian statistical approaches and see a few PROC examples to perform Bayesian analysis in this video.

Find more tutorials on the SAS Users YouTube channel.
SAS Training: Just a Click Away
Ready to level-up your skills? Choose your own adventure.
-
4 replies
-
08-12-2015 05:26 AM
-
3018 views
-
0 likes
-
4 in conversation
-
