- Home
- /
- Programming
- /
- SAS Procedures
- /
- Re: Proc report issue
- RSS Feed
- Mark Topic as New
- Mark Topic as Read
- Float this Topic for Current User
- Bookmark
- Subscribe
- Mute
- Printer Friendly Page


- Mark as New
- Bookmark
- Subscribe
- Mute
- RSS Feed
- Permalink
- Report Inappropriate Content
Good afternoon,
I have browsed through a lot of resources about this, but I can't seem to fin a solution:
I have the following code that gives me the table below: I can't find a way to add percentages and totals!! Does anybody know how to modify my code?
proc report data=full_data nowd ;
column Likert (medicalcondition, (agegroup));
define medicalcondition / across ' ';
define agegroup/ across ' ';
define Likert / group style(column)=Header;
rbreak after /ol summarize
style(summary)=Header{foreground=darkred};
run;
Table have:
| Condition A | Condition B | |||
| Likert | Parent | Child | Parent | Child |
| agree | 6 | 9 | 3 | 7 |
| neither agree nor disagree | 0 | 2 | . | 1 |
| somewhat agree | 1 | 3 | 5 | 3 |
| somewhat disagree | 1 | 0 | 0 | 0 |
| strongly agree | 12 | 6 | 12 | 9 |
| 20 | 20 | 20 | 20 | |
Table want:
| Condition A | Condition B | Totals | ||||||||
| Likert | Parent | % | Child | % | Parent | % | Child | % | Total | Total % |
| agree | 6 | 30% | 9 | 45% | 3 | 15% | 7 | 35% | 25 | 31% |
| neither agree nor disagree | 0 | 0% | 2 | 10% | 0 | 0% | 1 | 5% | 3 | 4% |
| somewhat agree | 1 | 5% | 3 | 15% | 5 | 25% | 3 | 15% | 12 | 15% |
| somewhat disagree | 1 | 5% | 0 | 0% | 0 | 0% | 0 | 0% | 1 | 1% |
| strongly agree | 12 | 60% | 6 | 30% | 12 | 60% | 9 | 45% | 39 | 49% |
| 20 | 100% | 20 | 100% | 20 | 100% | 20 | 100% | 80 | 100% | |
Accepted Solutions

- Mark as New
- Bookmark
- Subscribe
- Mute
- RSS Feed
- Permalink
- Report Inappropriate Content
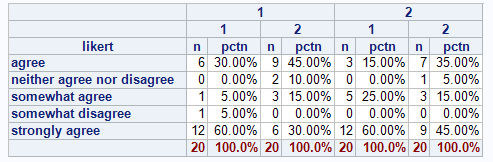
Look at the documentation regarding the statistics called PCTN. For example.
infile cards dsd;
input likert:$30. @;
do medicalCondition=1,2;
do agegroup=1,2;
input freq @;
output;
end;
end;
cards;
agree,6,9,3,7
neither agree nor disagree,0,2,0,1
somewhat agree,1,3,5,3
somewhat disagree,1,0,0,0
strongly agree,12,6,12,9
;;;;
run;
proc print;
run;
proc report data=summ nowd completerows list;
freq freq;
column Likert (medicalcondition, (agegroup,(n pctn)));
define medicalcondition / across ' ';
define agegroup/ across ' ';
define pctn / format=percent8.2;
define Likert / group style(column)=Header;
rbreak after /ol summarize
style(summary)=Header{foreground=darkred};
run;
- Mark as New
- Bookmark
- Subscribe
- Mute
- RSS Feed
- Permalink
- Report Inappropriate Content
Look at the documentation regarding the statistics called PCTN. For example.
infile cards dsd;
input likert:$30. @;
do medicalCondition=1,2;
do agegroup=1,2;
input freq @;
output;
end;
end;
cards;
agree,6,9,3,7
neither agree nor disagree,0,2,0,1
somewhat agree,1,3,5,3
somewhat disagree,1,0,0,0
strongly agree,12,6,12,9
;;;;
run;
proc print;
run;
proc report data=summ nowd completerows list;
freq freq;
column Likert (medicalcondition, (agegroup,(n pctn)));
define medicalcondition / across ' ';
define agegroup/ across ' ';
define pctn / format=percent8.2;
define Likert / group style(column)=Header;
rbreak after /ol summarize
style(summary)=Header{foreground=darkred};
run;
- Mark as New
- Bookmark
- Subscribe
- Mute
- RSS Feed
- Permalink
- Report Inappropriate Content
YES!
Thank you so much! 
- Mark as New
- Bookmark
- Subscribe
- Mute
- RSS Feed
- Permalink
- Report Inappropriate Content
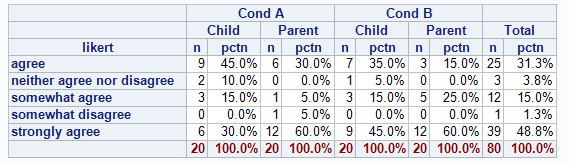
I didn't notice about the Total Column.
infile cards dsd;
input likert:$30. @;
do medicalCondition=1,2;
do agegroup=1,2;
input freq @;
output;
end;
end;
cards;
agree,6,9,3,7
neither agree nor disagree,0,2,0,1
somewhat agree,1,3,5,3
somewhat disagree,1,0,0,0
strongly agree,12,6,12,9
;;;;
run;
proc print;
run;
proc format;
value mcond 1='Cond A' 2='Cond B';
value agegr 1='Parent' 2='Child';
run;
proc report data=summ nowd missing completerows completecols list;
freq freq;
column Likert (medicalcondition, agegroup,(n pctn)) ('Total' (n pctn));
define medicalcondition / across ' ' format=mcond. ;
define agegroup / across ' ' format=agegr.;
define pctn / format=percent8.1;
define Likert / group style(column)=Header;
rbreak after /ol summarize
style(summary)=Header{foreground=darkred};
run;


- Mark as New
- Bookmark
- Subscribe
- Mute
- RSS Feed
- Permalink
- Report Inappropriate Content
John,
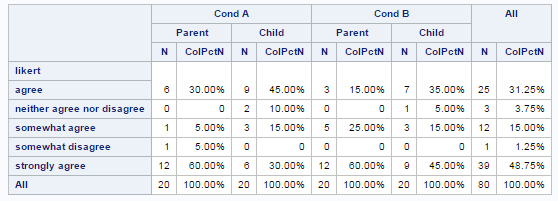
proc tabulate would be simpler to such scenario .
Code: Program
data summ;
   infile cards dsd;
   input likert:$30. @;
   do medicalCondition=1,2;
   do agegroup=1,2;
   input freq @;
   output;
   end;
   end;
   cards;
agree,6,9,3,7
neither agree nor disagree,0,2,0,1
somewhat agree,1,3,5,3
somewhat disagree,1,0,0,0
strongly agree,12,6,12,9
;;;;
   run;
   proc format;
   value mcond 1='Cond A' 2='Cond B';
   value agegr 1='Parent' 2='Child';
   picture pct low-high='009.99%' (mult=100);
   run;
options missing='0';
proc tabulate data=summ;
class likert medicalCondition agegroup;
freq freq ;
table likert all,medicalCondition=''*agegroup=''*freq=''*(n colpctn*format=pct8.2) all*(n colpctn*format=pct8.2);
format medicalcondition mcond. agegroup agegr.;
run;
Xia Keshan
- Mark as New
- Bookmark
- Subscribe
- Mute
- RSS Feed
- Permalink
- Report Inappropriate Content
The question was about PROC REPORT. The fact that you think tabulate is simpler is irrelevant.

Call for content now open!
It's your turn to help shape SAS Innovate 2027. Share your expertise and inspire the SAS community.
Learn the difference between classical and Bayesian statistical approaches and see a few PROC examples to perform Bayesian analysis in this video.
Find more tutorials on the SAS Users YouTube channel.
SAS Training: Just a Click Away
Ready to level-up your skills? Choose your own adventure.
-
5 replies
-
06-18-2015 03:29 PM
-
3722 views
-
3 likes
-
3 in conversation
-

