- Home
- /
- Programming
- /
- SAS Procedures
- /
- Re: Proc Report fits table size automatically
- RSS Feed
- Mark Topic as New
- Mark Topic as Read
- Float this Topic for Current User
- Bookmark
- Subscribe
- Mute
- Printer Friendly Page

- Mark as New
- Bookmark
- Subscribe
- Mute
- RSS Feed
- Permalink
- Report Inappropriate Content
Hi all,
I have a strange situation and somehow I can't find a solution for that:
proc report is used to create two different tables that are positioned so that columns fit in both tables. The number of columns is dynamic and can be changed
TABLE 1:
col1 col2 col3 ...
TABLE 2:
col1 col2 col3 ...
Proc Report allows to change column with fot every column, however, if certain size on the screen is filled with data then it starts to compress the columns in order to fit in. If there is no room to be saved any more then the table starts growing. If there are up to 7 columns (depends on information inside table) it works perfectly. The problem is that those two tables can have a lot of missing values (missing statement replaces those to zero).
I would like to keep all my columns like I defined it without any "help" from proc report. I have declared all the columns like this:
DEFINE PROFIT / GROUP CENTER STYLE(Column)=[Cellwidth=70];
As the question is about form and not what is showed inside the table, I will not insert the whole code.
I don't whant to use the With=100% statement because then it will fit the table all the the time to the area of 100%. I would like to see a small pair of tables if there are 3 columns and a huge one if someone would like to see 20 columns.
Is there a way to force proc report to use the defined cellwith?
Thank you for help,
Remo

- Mark as New
- Bookmark
- Subscribe
- Mute
- RSS Feed
- Permalink
- Report Inappropriate Content
Hi:
First of all, it's hard to understand what you mean because you can only use STYLE= overrides with ODS destinations (not the LISTING output) and HTML behaves differently than "paged" destinations like RTF and PDF. There is no way to answer your question without knowing the destination you've chosen. An HTML table shown on the screen can be as wide as it needs to be. It can be 120 columns wide and 5000 rows long. Since an HTML table does not have "page breaks", it is irrelevant to ODS how "wide" or how long you make the table. So with ODS HTML, I find myself only using CELLWIDTH as a style override if I really find some value or header wrapping where I don't want it to wrap. On the other hand, with RTF and PDF destinations, I frequently use CELLWIDTH (and other options) to try to fit more columns on a very wide report for RTF and PDF destinations. In fact, one of my first postings to the forums was a post on how to deal with very wide reports and "squeeze" as many columns as possible on RTF and/or PDF reports.
Your statement that "if certain size on the screen is filled with data then it starts to compress the columns in order to fit in. If there is no room to be saved any more then the table starts growing. If there are up to 7 columns (depends on information inside table) it works perfectly." Again, this is destination dependent. There's a difference between viewing an HTML file on a screen and viewing a PDF file in Adobe Reader on the screen, for example. Adobe Reader displays an image of what the report will look like when it is printed on a physical piece of paper, so ODS has already formatted the PDF output for a physical piece of paper when Adobe shows you the PDF file on the screen. So I'm not sure what you mean by "certain size on the screen is filled with data" -- WHAT "starts to compress the columns"???? Word, Reader? the browser????
And, the question is not only about form. The destination that you're using could be relevant. Knowing the destination might make a difference in the answer.. The code that you're using is relevant. Is this code inside a stored process? That could make a difference? How are you dynamically building the COLUMN statements for your code? Inside a SAS macro? That could also make a difference.
Generally speaking, for some destinations, I would NEVER do this:
DEFINE PROFIT / GROUP CENTER STYLE(Column)=[Cellwidth=70];
for example, for RTF and PDF using just a number without a unit of measure (such as IN, CM, PT, % etc) forces the destination to do a conversion from pixels to the unit of measure that the destination is most comfortable with.
Using SASHELP.SHOES, the code below produced the attached screenshots. You can compare the "width" of the 3 column report with the "width" of the 7 column report. I set the option to NOCENTER so you could see how the absolute number and unit of measure was used for REGION PRODUCT and SALES in each destination, no matter what number of columns was on the report. Compare the output from the 3 and 7 column reports with the report for the 15 columns without any cellwidth specification. RTF and PDF will "wrap" the columns, while HTML will continue to display ALL the columns.
I hope this helps. For more direct help, you might want to consider opening a track with Tech Support. They can look at all of your code and your data and help you come to the best resolution.
cynthia
options topmargin=.5in bottommargin=.5in rightmargin=.5in
leftmargin=.5in missing=0 nocenter;
title; footnote;
ods rtf file='c:\temp\testcolwidth.rtf' startpage=no;
ods pdf file='c:\temp\testcolwidth.pdf' startpage=no;
ods html file='c:\temp\testcolwidth.html';
proc report data=sashelp.shoes(obs=5) nowd;
column region product sales;
define region / style(column)={cellwidth=1.25in};
define product / style(column)={cellwidth=1.75in};
define sales / style(column)={cellwidth=1in};
compute before _page_;
line '1) Only 3 columns';
endcomp;
run;
proc report data=sashelp.shoes(obs=5) nowd;
column region product sales subsidiary returns inventory stores;
define region / style(column)={cellwidth=1.25in};
define product / style(column)={cellwidth=1.75in};
define sales / style(column)={cellwidth=1in};
compute before _page_;
line '2) Only 7 columns';
endcomp;
run;
ods _all_ close;
** compare to;
ods rtf file='c:\temp\verywide.rtf';
ods pdf file='c:\temp\verywide.pdf';
ods html file='c:\temp\verywide.html';
proc report data=sashelp.shoes(obs=5) nowd;
column region product sales subsidiary returns inventory stores
returns=r inventory=i sales=s product=p
returns=r2 inventory=i2 sales=s2 region=reg;
define region / 'Reg';
define product / 'Prod';
define sales / 'Sales';
compute before _page_;
line '3) Have 15 columns';
endcomp;
run;
ods _all_ close;
- Mark as New
- Bookmark
- Subscribe
- Mute
- RSS Feed
- Permalink
- Report Inappropriate Content
Hi Cynthia,
I'm sorry it was unclear the first time but I was kind of confused and didn't see that I haven't given the most important information in my description.
It is a page in SAS Portal, created with stored process. It is created directly using data _null_; file _webout and put '<html> ' logic. Table itself is created wirh proc report statement.
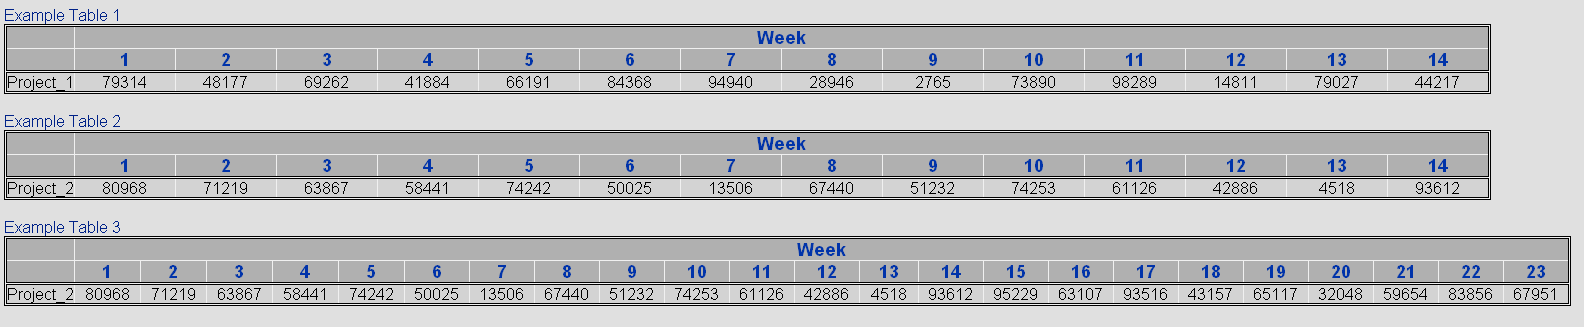
The problem I have is that having more than one table on the page I would like to see them lined up, so that all columns are at the position. Cellwidth statement should make all the columns width the same size. I uploaded a picture how I would like to see it (it is header only but gives a good idea what I mean)

Now I have changed the number of columns to be shown and the result looks different. The Weeks 10-13 (first 4 columns) are with different size. The code has not changed.

This is just an example where the beginning is changing. If I show two tables together then I can't say which column will have different width and on the screen it looks like a mess.
I would like to define a width and then keep it no matter how big is the number inside.
I hope this time I could explain the problem better.
Thanks for information.
- Mark as New
- Bookmark
- Subscribe
- Mute
- RSS Feed
- Permalink
- Report Inappropriate Content
Hi:
If you are generating your HTML code with DATA _NULL_, then you are essentially bypassing ODS. So I still don't understand what you mean when you say that the "page ...created with stored process ... is created directly using data _null_; file _webout and put '<html> ' logic. Table itself is created wirh proc report statement."
So I don't understand why the "page" even needs to be created with DATA _NULL_ and _webout and why/how the PROC REPORT "table" works in conjunction with DATA _NULL_ to get the headers you're posting. Just seeing 2 screenshots of the headers is not enough information to go on. Anything suggested is just a guess.
Someone really needs to look at all your code (including your DATA _NULL_ and PROC REPORT step) and your metadata information for the stored process and help you figure out what's happening. That's a job for SAS Tech Support. They can open a track and help you figure out the best way to write your stored process to run in the Portal and achieve the results you want.
To open a track with Tech Support, fill out the form at this link:
http://support.sas.com/ctx/supportform/createForm
cynthia
- Mark as New
- Bookmark
- Subscribe
- Mute
- RSS Feed
- Permalink
- Report Inappropriate Content
Hi,
I have created a example stored process to show what I mean. It's in most cases easier to read the code that to explain...
It's a simple stored process that will deliver 3 Tables. I will run this code in SAS Portal and get the result that bothers me so much. It is very similar to the original code, I left out css part as I'm not a web-designer and can't read this file. My SAS is working on Unix and I can't save ODS Output. We use Internet Explorer.
The situation I have created here is a page with 3 Tables and all of them use Proc Report and I have tried to define the witdh of Week column so that all three tables would have the same order which is easier to follow. Now, the table 3 has more columns than other two and for some reason the cellwitdh is not working anymore. I don't mind if it goes outside of screen but I would like to keep the [cellwitdh = 100].
The full code to create the result is attached. maybe an example of PROC REPORT that I use:
ods htmlbody = _webout;
rs=none style=moderntable;
options noquotelenmax;
PROC REPORT data = Data1 nowd NOCENTER SPANROWS
STYLE(HEADER) = [font_weight=bold]
STYLE(REPORT) = [cellspacing=1 cellpadding=0];
COLUMN Name week, profit;
define Name / ' ' GROUP ORDER=DATA;
define week / across order=DATA center 'Week' style={font_weight=bold just=c};
define profit / SUM ' ' center style=[CELLWIDTH=100];
run;
ods html close;
I have very limited access to the server and for me it doesn't look like technical problem. It seems to be some logic that SAS uses and I would like to understand what exactly is going on.
Remo

- Mark as New
- Bookmark
- Subscribe
- Mute
- RSS Feed
- Permalink
- Report Inappropriate Content
Maybe if you gave it units for the width?
- Mark as New
- Bookmark
- Subscribe
- Mute
- RSS Feed
- Permalink
- Report Inappropriate Content
Hi:
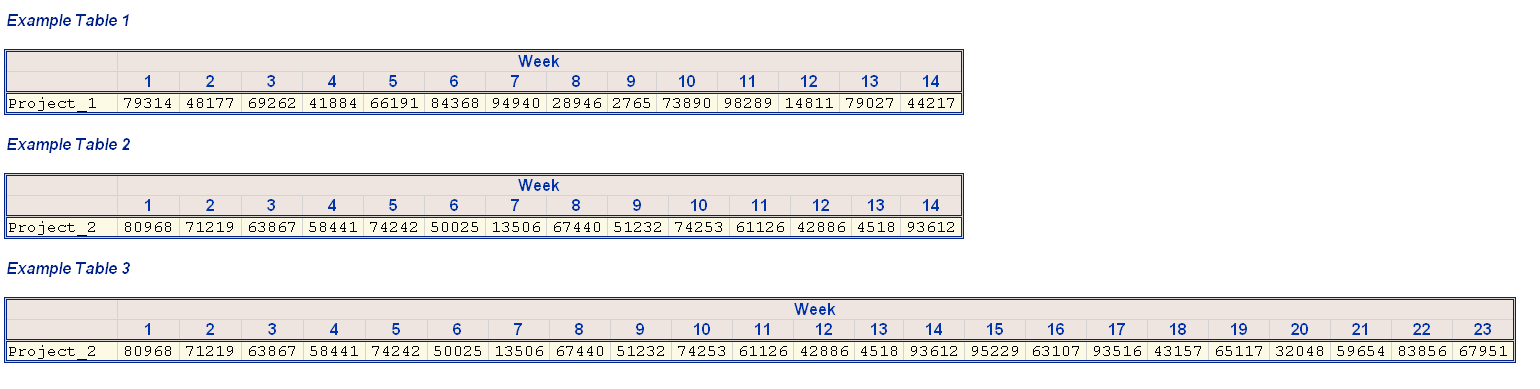
I still don't understand why you are using your own HTML statements and then using ODS HTML as well. I still think you want to check that with Tech Support. I think it is unnecessary. I do not have a stored process server to test on and I will be teaching the rest of the week and unable to test on one, but in a batch job, I was able to greatly simplify your code and get this output (see screenshot).
Basically, since PROFIT is under WEEK (an ACROSS usage), I believe that the calculation for cellwidth was getting confused. So I took a different approach. I set a fixed size for NAME. And, then gave an overall outputwidth for the WHOLE REPORT. Then I came up with the same size (10in) for report #1 and #2 and a different size (15.75) for report #3.
Code below is what I used. I prefer to work in inches as my unit of measure instead of pixels, which is the default unit used for HTML, when you do not specify a unit of measure. I also got rid of your DATA _NULL_ and just used a TITLE statement for the caption above each table. The other thing I did was to correct your STYLE override. PROC REPORT really wants to have the style specified as:
style(area)={attribute=value}
where AREA is either HEADER or COLUMN on the DEFINE statement. You did not have an area on your DEFINE style overrides, which was additionally making REPORT do more work for every DEFINE. Also, I didn't both to make DATA1, DATA2 and DATA3 files for PROC REPORT, since REPORT supports the use of the WHERE statement directly, I was just able to use TESTDATA for each step (with the appropriate WHERE).
cynthia
/* Testdata */
data testdata;
length name $9 week 8 profit 8;
infile datalines;
input name $ week profit ;
datalines;
Project_1 1 79314
Project_1 2 48177
Project_1 3 69262
Project_1 4 41884
Project_1 5 66191
Project_1 6 84368
Project_1 7 94940
Project_1 8 28946
Project_1 9 2765
Project_1 10 73890
Project_1 11 98289
Project_1 12 14811
Project_1 13 79027
Project_1 14 44217
Project_2 1 80968
Project_2 2 71219
Project_2 3 63867
Project_2 4 58441
Project_2 5 74242
Project_2 6 50025
Project_2 7 13506
Project_2 8 67440
Project_2 9 51232
Project_2 10 74253
Project_2 11 61126
Project_2 12 42886
Project_2 13 4518
Project_2 14 93612
Project_2 15 95229
Project_2 16 63107
Project_2 17 93516
Project_2 18 43157
Project_2 19 65117
Project_2 20 32048
Project_2 21 59654
Project_2 22 83856
Project_2 23 67951
;
run;
proc template;
define style egdfnobr;
parent=styles.EGDEFAULT;
style body from body /
pagebreakhtml=_undef_;
end;
run;
ods HTML body='c:\temp\testcellwidth.html'
rs=none style=egdfnobr;
options noquotelenmax;
/* ------ Table 1 ------ */
title j=l h=12pt 'Example Table 1';
PROC REPORT data = testdata nowd NOCENTER SPANROWS
STYLE(HEADER) = [font_weight=bold]
STYLE(REPORT) = [cellspacing=1 cellpadding=0 outputwidth=10in];
where name = 'Project_1';
COLUMN Name week, profit ;
define Name/' ' GROUP ORDER=DATA style(header)={cellwidth=1in};
define Week/across order=DATA center 'Week'
style(header)={font_weight=bold just=c }
style(column)={font_weight=bold just=c };
DEFINE profit /SUM '' center style(column)=[just=c];
run;
/* ------ Table 2 ------ */
title j=l h=12pt 'Example Table 2';
PROC REPORT data = testdata nowd NOCENTER SPANROWS
STYLE(HEADER) = [font_weight=bold]
STYLE(REPORT) = [cellspacing=1 cellpadding=0 outputwidth=10in];
WHERE Name = 'Project_2' AND Week le 14;
COLUMN Name week, profit ;
define Name/' ' GROUP ORDER=DATA style(header)={cellwidth=1in};
define Week/across order=DATA center 'Week'
style(header)={font_weight=bold just=c }
style(column)={font_weight=bold just=c };
DEFINE profit /SUM '' center style(column)=[just=c];
run;
/* ------ Table 3 ------ */
title j=l h=12pt 'Example Table 3';
PROC REPORT data = testdata nowd NOCENTER SPANROWS
STYLE(HEADER) = [font_weight=bold ]
STYLE(REPORT) = [cellspacing=1 cellpadding=0 outputwidth=15.75in];
WHERE Name = 'Project_2';
COLUMN Name week, profit ;
define Name/' ' GROUP ORDER=DATA style(header)={cellwidth=1in};
define Week/across order=DATA center 'Week'
style(header)={font_weight=bold just=c }
style(column)={font_weight=bold just=c };
DEFINE profit /SUM '' center style(column)=[just=c];
run;
ods html close;
title;

- Mark as New
- Bookmark
- Subscribe
- Mute
- RSS Feed
- Permalink
- Report Inappropriate Content
Hi,
thank you very much. This seems to do exactly what I need. I will try it in my code and hope that it works out fine. it's very interesting approach.
And thanks for pointing out the mistake in style statement. I have learned that some smaller mistakes are automatically corrected in SAS but it takes time and you never know what is the outcome.
I can't answer the question about HTML statement because I don't know. Maybe it's necessary to Design the whole page where Tables are just a part of it.
.jpg")
Catch up on SAS Innovate 2026
Nearly 200 sessions are now available on demand with the SAS Innovate Digital Pass.
Explore Now →Learn the difference between classical and Bayesian statistical approaches and see a few PROC examples to perform Bayesian analysis in this video.

Find more tutorials on the SAS Users YouTube channel.
SAS Training: Just a Click Away
Ready to level-up your skills? Choose your own adventure.
-
7 replies
-
02-19-2013 03:44 PM
-
21221 views
-
1 like
-
3 in conversation
-
