- Home
- /
- Programming
- /
- SAS Procedures
- /
- Proc Gchart
- RSS Feed
- Mark Topic as New
- Mark Topic as Read
- Float this Topic for Current User
- Bookmark
- Subscribe
- Mute
- Printer Friendly Page

- Mark as New
- Bookmark
- Subscribe
- Mute
- RSS Feed
- Permalink
- Report Inappropriate Content
Hi!
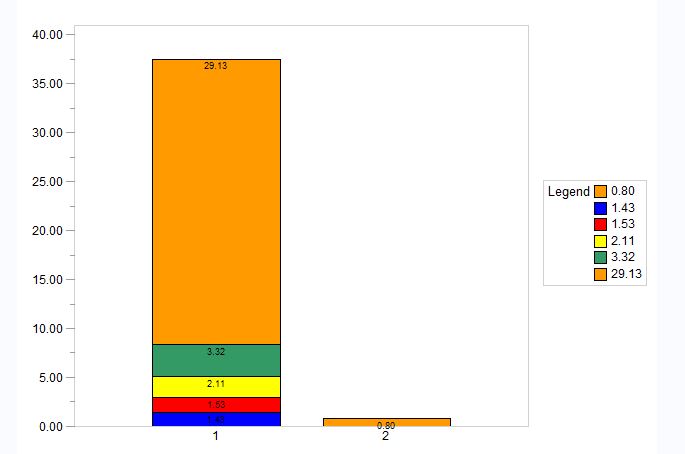
I have some problems with Proc Gchart.
As you see in the attached graph, the biggest bars are at the top of the graph but I rather want the biggest bars at the bottom of the graph
For example, I want the orange bar to be at the bottom of the graph, does anyone know how I can manage to do that?
I have created the graph in enterprise guide, but I’ll attach the code that generates the graph and hopefully someone can solve my problem with code.
Best Regards
Hannes
PROC SQL;
CREATE VIEW WORK.SORTTempTableSorted AS
SELECT T.AAA, T.Arb_Totalt_red
FROM WORK.QUERY_FOR_VECKOARBETSTID_HE_0000 as T
;
QUIT;
PATTERN1 COLOR=CXFF9900;
PATTERN2 COLOR=BLUE;
PATTERN3 COLOR=RED;
PATTERN4 COLOR=YELLOW;
PATTERN5 COLOR=CX339966;
PATTERN6 COLOR=CXFF9900;
PATTERN7 COLOR = _STYLE_;
PATTERN8 COLOR = _STYLE_;
PATTERN9 COLOR = _STYLE_;
PATTERN10 COLOR = _STYLE_;
PATTERN11 COLOR = _STYLE_;
PATTERN12 COLOR = _STYLE_;
Legend1
FRAME
POSITION = (MIDDLE RIGHT OUTSIDE)
LABEL=( "Legend")
;
Axis1
STYLE=1
WIDTH=1
MINOR=
(NUMBER=1
)
LABEL=( " ")
;
Axis2
STYLE=1
WIDTH=1
LABEL=( " ")
;
TITLE;
FOOTNOTE;
PROC GCHART DATA=WORK.SORTTempTableSorted
;
VBAR
AAA
/
SUMVAR=Arb_Totalt_red
SUBGROUP=Arb_Totalt_red
CLIPREF
FRAME TYPE=MEAN
INSIDE=SUM
LEGEND=LEGEND1
COUTLINE=BLACK
RAXIS=AXIS1
MAXIS=AXIS2
;
RUN; QUIT;
TITLE; FOOTNOTE;
PATTERN1;
PATTERN2;
PATTERN3;
PATTERN4;
PATTERN5;
PATTERN6;

- Mark as New
- Bookmark
- Subscribe
- Mute
- RSS Feed
- Permalink
- Report Inappropriate Content
Hi,
TBH I don't really use GChart as now using sgplot or GTL, so not sure how useful my response will be here. What I think you would need to do is to explicitly set YAXIS values to be (40, 35, 30, 25, 20...) i.e. in reverse. Not sure how you would do it in GChart but below is some syntax for sgplot:
yaxis label="Label" values=(40,35,30,25,20,15,10,5,0);
To add, the SAS help on SGPLOT:
http://support.sas.com/documentation/cdl/en/grstatproc/62603/HTML/default/viewer.htm#xaxis-stmt.htm

- Mark as New
- Bookmark
- Subscribe
- Mute
- RSS Feed
- Permalink
- Report Inappropriate Content
Generally the approach would be to sort or order the data by an appropriate variable the first group seen is on the bottom. The values in this case look like all you need is to either use an ORDER BY Arb_Totalt_red clause in your SQL.
Often I end up adding a variable to represent a final order after seeing the first version of the chart to do the sort.
.jpg")
Catch up on SAS Innovate 2026
Nearly 200 sessions are now available on demand in the Innovate Hub.
Watch Now →Learn the difference between classical and Bayesian statistical approaches and see a few PROC examples to perform Bayesian analysis in this video.

Find more tutorials on the SAS Users YouTube channel.
SAS Training: Just a Click Away
Ready to level-up your skills? Choose your own adventure.
-
2 replies
-
09-16-2014 05:05 AM
-
2071 views
-
0 likes
-
3 in conversation
-
