- Home
- /
- Programming
- /
- SAS Procedures
- /
- Problem Graph
- RSS Feed
- Mark Topic as New
- Mark Topic as Read
- Float this Topic for Current User
- Bookmark
- Subscribe
- Mute
- Printer Friendly Page
- Mark as New
- Bookmark
- Subscribe
- Mute
- RSS Feed
- Permalink
- Report Inappropriate Content
Hello everyone,
I'm trying to make a graph using the price of 4 stocks (Goldman sachs, coca cola, yahoo and apple) on the same graph. I have taken their daily value from 2007 till 2014 (8 years) and I want to make a graph to see the evolution of the 4 stocks on the same graph. When I tried with the command below, I get something too concentrated (for example, the apple stock varies from 20 to more than 600 during these 8 years). Can you tell me what I can do to have a good graph ? Here is the command I used :
/* représentation graphique des cours boursiers */
proc gplot Skalli.base_union ;
symbol1 interpol=join value=none color=blue ;
symbol2 interpol=join value=none color=red ;
symbol3 interpol=join value=none color=green ;
symbol4 interpol=join value=none color=purple ;
plot (Goldman_Sachs coca_cola Yahoo Apple_)*Date / legend overlay ;
Title "Représentation des cours des quatre actions qui composent notre portefeuile" ;
run ;
ods rtf close;
Quit ;
I also tried this command :
/* Définir le titre */
title1 "Représentation des cours des quatre actions qui composent notre portefeuile";
/* Définir les symboles */
symbol1 interpol=join value=none color=blue height=2;
symbol2 interpol=join value=none color=red height=2;
symbol3 interpol=join value=none color=green height=2;
symbol4 interpol=join value=none color=purple height=2;
/* Define axis characteristics */
axis1 label=("Date") minor=none offset=(1,1);
axis2 label=(angle=90 "Cours")
order=(0 to 800 by 50) minor=(n=1);
proc gplot Skalli.base_union ;
plot (Goldman_Sachs coca_cola Yahoo Apple_)*Date / overlay legend=legend1
haxis=axis1 vaxis=axis2;
run;
quit;
Can you tell me what I can do to have a good graph ?What command can I add to have a better result ?
Thank you very much.
- Mark as New
- Bookmark
- Subscribe
- Mute
- RSS Feed
- Permalink
- Report Inappropriate Content
Hi:
Have you considered the SG Procedures? Sometimes they are much easier than GPLOT. See this paper:
from: http://www2.sas.com/proceedings/forum2008/255-2008.pdf
cynthia
- Mark as New
- Bookmark
- Subscribe
- Mute
- RSS Feed
- Permalink
- Report Inappropriate Content
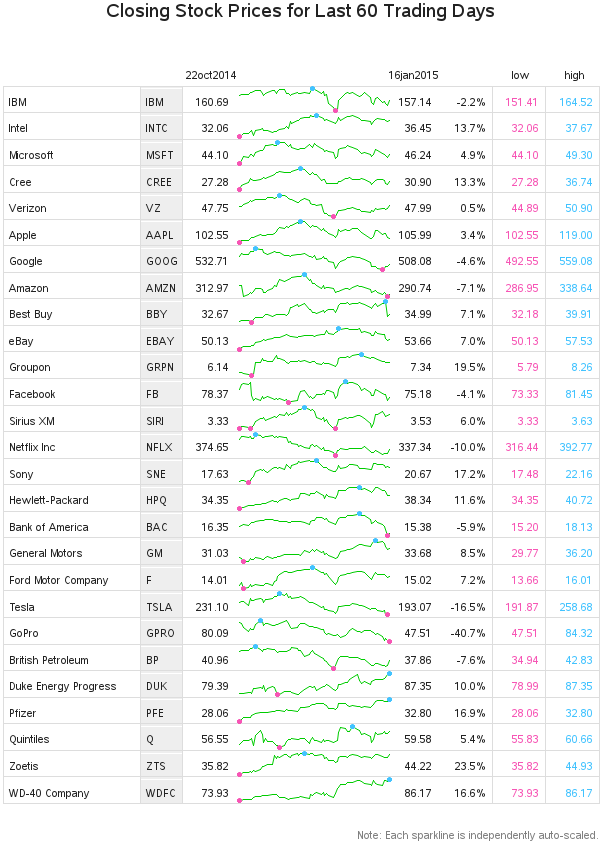
Since each stock's price can be in a different price range (sometimes *very* different), it is often not fair to plot/compare them to the same scale. One thing I've found it useful to do is to plot each stock separately, and let each one auto-scale.
I show, in detail, how to do this in Example 14 of my book SAS/Graph: Beyond the Basics. Here is the code from that example:
http://robslink.com/SAS/book/example14.sas
And here is an example of what it looks like when you plot several different stocks:

April 27 – 30 | Gaylord Texan | Grapevine, Texas
Registration is open
Walk in ready to learn. Walk out ready to deliver. This is the data and AI conference you can't afford to miss.
Register now and save with the early bird rate—just $795!
Learn the difference between classical and Bayesian statistical approaches and see a few PROC examples to perform Bayesian analysis in this video.
Find more tutorials on the SAS Users YouTube channel.
SAS Training: Just a Click Away
Ready to level-up your skills? Choose your own adventure.


