- Home
- /
- Programming
- /
- SAS Procedures
- /
- Re: Plot Graph for 2 group Linear Discriminant Function
- RSS Feed
- Mark Topic as New
- Mark Topic as Read
- Float this Topic for Current User
- Bookmark
- Subscribe
- Mute
- Printer Friendly Page

- Mark as New
- Bookmark
- Subscribe
- Mute
- RSS Feed
- Permalink
- Report Inappropriate Content
Hi,
I've run a discriminant analysis for a binary category group & the code I used is the following:
proc discrim data=discrim;
class group;
var var1 var2 var3 var4 var5;
run;
Now, I want to plot the each groups discriminant scores across the 1st linear discriminant function. Can anybody please tell me the code to do it?
Regards,
Ari14
Accepted Solutions

- Mark as New
- Bookmark
- Subscribe
- Mute
- RSS Feed
- Permalink
- Report Inappropriate Content
You can use the following code to get linearDisdinctFunction ,then use proc gplot
ods output LinearDiscFunc=line;
proc discrim data=sashelp.iris method=normal pool=yes;
class Species;
var PetalWidth;
title2 ’Using Normal Density Estimates with Equal Variance’;
run;
Ksharp

- Mark as New
- Bookmark
- Subscribe
- Mute
- RSS Feed
- Permalink
- Report Inappropriate Content
Not really certain what it is you are attempting to accomplish here but you might find this helpful:
ods output LinearDiscFunc=discrim_results;
proc discrim data=discrim;
class=group;
var var1-var5;
run;
- Mark as New
- Bookmark
- Subscribe
- Mute
- RSS Feed
- Permalink
- Report Inappropriate Content
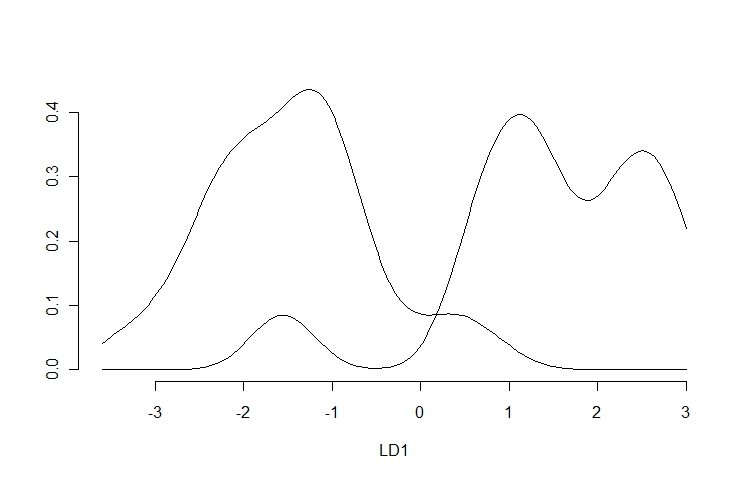
Hi,
I R software, one can visualy examine how well the discriminant function demarcate the 2 groups. Please find the snap below. But in SAS I just can't able to do it. I was just looking for SAS code to get a plot like the one below.
- Mark as New
- Bookmark
- Subscribe
- Mute
- RSS Feed
- Permalink
- Report Inappropriate Content
You can use the following code to get linearDisdinctFunction ,then use proc gplot
ods output LinearDiscFunc=line;
proc discrim data=sashelp.iris method=normal pool=yes;
class Species;
var PetalWidth;
title2 ’Using Normal Density Estimates with Equal Variance’;
run;
Ksharp
- Mark as New
- Bookmark
- Subscribe
- Mute
- RSS Feed
- Permalink
- Report Inappropriate Content
Thanks Ksharp!
.jpg")
Catch up on SAS Innovate 2026
Nearly 200 sessions are now available on demand in the Innovate Hub.
Watch Now →Learn the difference between classical and Bayesian statistical approaches and see a few PROC examples to perform Bayesian analysis in this video.

Find more tutorials on the SAS Users YouTube channel.
SAS Training: Just a Click Away
Ready to level-up your skills? Choose your own adventure.
-
4 replies
-
08-18-2011 01:06 AM
-
3910 views
-
0 likes
-
3 in conversation
-
