- Home
- /
- Programming
- /
- SAS Procedures
- /
- Pivot type reports
- RSS Feed
- Mark Topic as New
- Mark Topic as Read
- Float this Topic for Current User
- Bookmark
- Subscribe
- Mute
- Printer Friendly Page

- Mark as New
- Bookmark
- Subscribe
- Mute
- RSS Feed
- Permalink
- Report Inappropriate Content
What is the easiest way to create pivot type reports?

- Mark as New
- Bookmark
- Subscribe
- Mute
- RSS Feed
- Permalink
- Report Inappropriate Content
proc tabulate;
PG
- Mark as New
- Bookmark
- Subscribe
- Mute
- RSS Feed
- Permalink
- Report Inappropriate Content
Thanks. Proc Tabulate seems cumbersome to me. Do you know if FREQ be used with more than a 2x2 table without page breaks for the additional dimensions? (Like Crosstabs in SPSS).
- Mark as New
- Bookmark
- Subscribe
- Mute
- RSS Feed
- Permalink
- Report Inappropriate Content
Proc freq is limited to frequencies. But the tables can be of any size . The procedure will put as many tables as will fit on a page except if you use the PAGE option. For one-way tables, if you want it tobegin the next table on the same page even if it will not fit completely then you can use the COMPRESS option.
Take another look at proc tabulate. Start simple with something like
Proc tabulate data=myDataSet;
class myLineVar1 myLineVar2 myColVar1 myColVar2;
var myStatVar;
tables myLineVar1*myLineVar2, myColVar1*myColVar2*myStatVar*N;
run;
Good luck.
PG
- Mark as New
- Bookmark
- Subscribe
- Mute
- RSS Feed
- Permalink
- Report Inappropriate Content
I've used PROC TABULATE, but so infrequently that it is difficult for me to recall what I did without referencing the manual. With FREQ I wanted to know if there was a way of handling multiple dimensions in a single table. For example, A*B*C would, I believe produce a table of B*C for each level of A. Could it produce a single table with panel for each level of A (like what can be done with TABULATE)?

- Mark as New
- Bookmark
- Subscribe
- Mute
- RSS Feed
- Permalink
- Report Inappropriate Content
What is your data and what output do you like.
Maybe ODS + proc freq can get what you want.
Ksharp
- Mark as New
- Bookmark
- Subscribe
- Mute
- RSS Feed
- Permalink
- Report Inappropriate Content
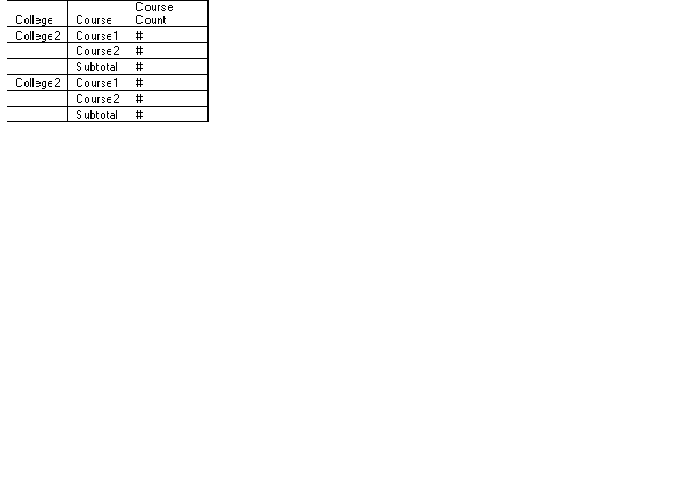
I want to be able to produce a report A*B*C with variable B nested within variable A (with the cells being a frequency counter--like with FREQ). A and B appear as row variables annd C is a column variable. Example:

- Mark as New
- Bookmark
- Subscribe
- Mute
- RSS Feed
- Permalink
- Report Inappropriate Content
Did you try the LIST option?
tables a*b*c/list;

- Mark as New
- Bookmark
- Subscribe
- Mute
- RSS Feed
- Permalink
- Report Inappropriate Content
data have;
input (id Name Gender Date) (:$10.);
cards;
1 Dan M 1/1/2012
1 Dan M 12/23/2011
1 Dan M 10/15/2011
1 Dan M 9/17/2011
2 Carol F 8/12/2011
2 Carol F 7/15/2011
;
run;
data want;
set have;
by id;
name=ifc(first.id,name,' ');
gender=ifc(first.id,gender,' ');
run;
proc freq data = want;
tables id*name*gender / list missing norow nocol nopercent nocum out=temp;
run;
libname test 'c:\temp\test.xls';
proc sql;
drop table test.sheet1;
quit;
data test.sheet1;
set temp;
run;
libname test clear;
- Mark as New
- Bookmark
- Subscribe
- Mute
- RSS Feed
- Permalink
- Report Inappropriate Content
Here is another exmple that might help you
data want;
input grp $ deal $ first $;
cards;
FVJK TEST1 1
FVJK TEST2 1
FVJK TEST1 1
FVJK TEST3 1
FRGH TEST3 2
FRGH TEST3 2
FRGH TEST5 2
FRGH TEST6 2
run;
proc freq data = want;
tables grp*deal*first / list missing norow nocol nopercent nocum out=temp;
run;
data temp1;
set temp;
by grp;
grp=ifc(first.grp,grp,' ');
run;
proc print; run;
PROC EXPORT DATA= work.temp1
OUTFILE= "C:Test.xls"
DBMS=EXCEL REPLACE;
SHEET="T";
RUN;
Obs grp deal first COUNT PERCENT
1 FRGH TEST3 2 2 25.0
2 TEST5 2 1 12.5
3 TEST6 2 1 12.5
4 FVJK TEST1 1 2 25.0
5 TEST2 1 1 12.5
6 TEST3 1 1 12.5
- Mark as New
- Bookmark
- Subscribe
- Mute
- RSS Feed
- Permalink
- Report Inappropriate Content
Oh. proc tabulate is better.
data want;
input grp $ deal $ first $;
cards;
FVJK TEST1 1
FVJK TEST2 1
FVJK TEST1 1
FVJK TEST3 1
FRGH TEST3 2
FRGH TEST3 2
FRGH TEST5 2
FRGH TEST6 2
run;
proc freq data = want noprint ;
tables grp*deal*first / list nopercent nocum out=temp(drop=percent);
run;
ods tagsets.excelxp file='c:\temp\x.xls' style=sasweb;
proc tabulate data=temp;
class grp deal first ;
var count;
table grp=''*(deal='' all='sub_total'),first=''*count*sum='';
run;
ods tagsets.excelxp close;
Ksharp
- Mark as New
- Bookmark
- Subscribe
- Mute
- RSS Feed
- Permalink
- Report Inappropriate Content
I guess it comes back to TABULATE and ODS being the best tools for this. Thanks for your help.
.jpg")
Catch up on SAS Innovate 2026
Nearly 200 sessions are now available on demand in the Innovate Hub.
Watch Now →Learn the difference between classical and Bayesian statistical approaches and see a few PROC examples to perform Bayesian analysis in this video.

Find more tutorials on the SAS Users YouTube channel.
SAS Training: Just a Click Away
Ready to level-up your skills? Choose your own adventure.
-
11 replies
-
03-19-2012 01:46 PM
-
6127 views
-
0 likes
-
5 in conversation
-
