- Home
- /
- Programming
- /
- SAS Procedures
- /
- Re: PROC SGSCATTER: Help an Interpretation
- RSS Feed
- Mark Topic as New
- Mark Topic as Read
- Float this Topic for Current User
- Bookmark
- Subscribe
- Mute
- Printer Friendly Page

- Mark as New
- Bookmark
- Subscribe
- Mute
- RSS Feed
- Permalink
- Report Inappropriate Content
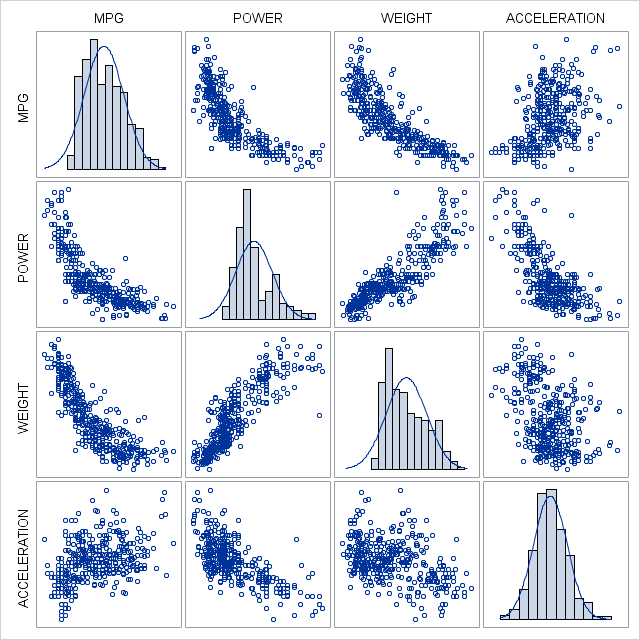
An automaker company is planning to advertise their newest car. The most important component of an advertisement focuses on fuel economy of the car measured in miles per gallon. Consequently, marketing people hired for that automaker are interested in predicting miles per gallon for the car based on: a total weight of a car measured in kilograms (WEIGHT), acceleration of a car measured in seconds (ACCELERATION), and power measured in horsepower (POWER).
My sample data is like
| MPG | POWER | WEIGHT | ACCELERA |
|---|---|---|---|
18 | 130 | 3504 | 12 |
| 15 | 165 | 3652 | 11.2 |
| ... | ... | ... | ... |
What PROC procedure is good for explaining some question?
and If you can give the good answer, please help me.
| Q | Using an appropriate PROC procedure, provide one plot which visualizes a degree of dependence between given variables (exactly this is what I don't know). |
| a. | What can you conclude based on the plot? |
| b. | Are any regression assumptions (which can be visually examined) violated? |
| c. | If so, which assumptions and for which variables? Is there any way to fix those problems? |
Thanks in advance.
Okay I found out this.
Can you help me for questions a, b, c under the plot?
I will attach one jpg.
PROC SGSCATTER

- Mark as New
- Bookmark
- Subscribe
- Mute
- RSS Feed
- Permalink
- Report Inappropriate Content
My statistical theory knowledge is limited. Hope Some experts can give you more detail information.
QUsing an appropriate PROC procedure, provide one plot which visualizes a degree of dependence between given variables (exactly this is what I don't know).
proc corr can do this job.
a.What can you conclude based on the plot?
power and weight has highly positive correlation .that means there are multicollinearity. so you need to drop one of them when you build a reg model.
MPG with power or weight has highly negative correlation.
b.Are any regression assumptions (which can be visually examined) violated?
multicollinearity is the point.
c.If so, which assumptions and for which variables? Is there any way to fix those problems?
drop one of them (power or weight), So model might be MPG=weight accelera .
I prefer to choose weight not power because power and MPG has more correlation than weight and MPG.
Ksharp

- Mark as New
- Bookmark
- Subscribe
- Mute
- RSS Feed
- Permalink
- Report Inappropriate Content
I would also note that the relationships between MPG and either Weight or Power appear to be non-linear.
I would also be tempted to examine this data in Proc G3d.

- Mark as New
- Bookmark
- Subscribe
- Mute
- RSS Feed
- Permalink
- Report Inappropriate Content
There's more than one way to answer this question, it depends a bit on what they're looking for and I'm not 100% sure.
Using an appropriate PROC procedure, provide one plot which visualizes a degree of dependence between given variables
For some reason the answer that pops into my mind is proc reg with some of the plot statements (CORR) in that procedure. Proc sgscatter may be appropriate as well, but it looks at the relationship between variables, but I'm not sure I'd classify that as 'degree of dependence'.
What can you conclude based on the plot?
Are any regression assumptions (which can be visually examined) violated?
My answer to this would be the normal distribution of the error terms. And proc reg has some diagnostic plots that allow you to determine if it is violated or not.
Multi collinearity is also a valid suggestion.
If so which assumptions and how to fix?
Fix multi collinearity by not including both terms
Fix non-normal distribution of errors by transforming variables as required, ie log transform for certain variables.
- Mark as New
- Bookmark
- Subscribe
- Mute
- RSS Feed
- Permalink
- Report Inappropriate Content
Thanks at all!
This was answers. Is it too bad? : )
a. POWER and WEIGHT is a linear regression and positive direction. However other
variables are nonlinear and negative direction. Only MPG and ACCELARATION look like
no relationships.
b. Normality and Linearity may be violated.
c. POWER and WEIGHT are violated with Normality and Linearity. In such problems, a
nonlinear transformation of variables might cure both problems
.jpg")
Catch up on SAS Innovate 2026
Nearly 200 sessions are now available on demand in the Innovate Hub.
Watch Now →Learn the difference between classical and Bayesian statistical approaches and see a few PROC examples to perform Bayesian analysis in this video.

Find more tutorials on the SAS Users YouTube channel.
SAS Training: Just a Click Away
Ready to level-up your skills? Choose your own adventure.
-
4 replies
-
10-31-2012 09:59 PM
-
3052 views
-
0 likes
-
4 in conversation
-
