- Home
- /
- Programming
- /
- SAS Procedures
- /
- OUTPUT
- RSS Feed
- Mark Topic as New
- Mark Topic as Read
- Float this Topic for Current User
- Bookmark
- Subscribe
- Mute
- Printer Friendly Page

- Mark as New
- Bookmark
- Subscribe
- Mute
- RSS Feed
- Permalink
- Report Inappropriate Content
Hello All,
I was trying to create an output for the dataset
ID Date Plan
1 jan2013 a
1 feb2013 a
1 mar2013 a
1 may2013 b
1 jun2013 b
1 jul2013 a
1 aug2013 a
the output i'm looking to get is ID Plan Date_range
1 a 1-3
2 b 5-6
3 a 7-8
Thanks. Looking forward to some responses.
Accepted Solutions

- Mark as New
- Bookmark
- Subscribe
- Mute
- RSS Feed
- Permalink
- Report Inappropriate Content
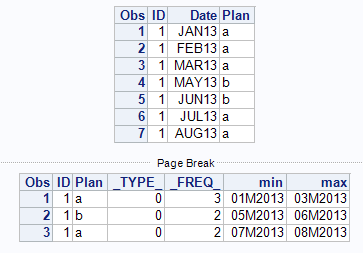
You can format the min and max into date range yourself right?
input ID Date:monyy. Plan :$1.;
format date monyy.;
cards;
1 jan2013 a
1 feb2013 a
1 mar2013 a
1 may2013 b
1 jun2013 b
1 jul2013 a
1 aug2013 a
;;;;
run;
proc print;
run;
proc summary data=date nway;
by id plan notsorted;
format date mmyy.;
output out=range min(date)=min max(date)=max;
run;
proc print;
run;
- Mark as New
- Bookmark
- Subscribe
- Mute
- RSS Feed
- Permalink
- Report Inappropriate Content
Thank you so much for the help.
.jpg")
Catch up on SAS Innovate 2026
Nearly 200 sessions are now available on demand in the Innovate Hub.
Watch Now →Learn the difference between classical and Bayesian statistical approaches and see a few PROC examples to perform Bayesian analysis in this video.

Find more tutorials on the SAS Users YouTube channel.
SAS Training: Just a Click Away
Ready to level-up your skills? Choose your own adventure.
-
2 replies
-
02-19-2015 05:22 PM
-
1620 views
-
0 likes
-
2 in conversation
-
