- Home
- /
- Programming
- /
- SAS Procedures
- /
- Looking for Precision Up to Maybe 8 Decimal Places in proc rank
- RSS Feed
- Mark Topic as New
- Mark Topic as Read
- Float this Topic for Current User
- Bookmark
- Subscribe
- Mute
- Printer Friendly Page

- Mark as New
- Bookmark
- Subscribe
- Mute
- RSS Feed
- Permalink
- Report Inappropriate Content
I use the following code to obtain the percentiles of over 100,000 observations:
proc rank data = CombineScoredTemp groups = 100 out = CombineScoredTemp;
var Predicted_SLR;
ranks Percentile_SLR;
run;
But it provides the percentiles as integers. Any suggestions on how to get a real number out of this?
Thank you, as usual.

- Mark as New
- Bookmark
- Subscribe
- Mute
- RSS Feed
- Permalink
- Report Inappropriate Content
Do you mean that you want 0.01000000 instead of 1? Or 1.00000000?
SAS actually does not differentiate between integer and real in its storage. The active display format controls how many, if any, decimals are displayed. Print your resulting set with Format Percentile_slr F16.8 ; to see more decimals.
If you want to know the percentiles as in which value is the 7th percentile you likely need another procedure than rank as except for tie breaking ranks tend to be integer.

- Mark as New
- Bookmark
- Subscribe
- Mute
- RSS Feed
- Permalink
- Report Inappropriate Content
proc rank ranks data based on Predicted_SLR variable and makes 100 groups each contains around 1000 observations. For percentile try proc univariate.
- Mark as New
- Bookmark
- Subscribe
- Mute
- RSS Feed
- Permalink
- Report Inappropriate Content
I think you're looking for the CDF instead:
ods table cdfplot=want;;
proc univariate data=CombineScoredTemp;
var Predicted_SLR;
cdfplot Predicted_SLR;
run;quit;
- Mark as New
- Bookmark
- Subscribe
- Mute
- RSS Feed
- Permalink
- Report Inappropriate Content
Thank you for all of the answers. CDF seems to show the most promise. But how may I modify the code to accomodate saving the actual percentile on a record-by-record basis?
This would be the equivalent of a PERCENTRANK() function in Excel.
Thanks.
- Mark as New
- Bookmark
- Subscribe
- Mute
- RSS Feed
- Permalink
- Report Inappropriate Content
i'm not sure what your question is. Can you clarify what you mean by saving and row by row? The output dataset has the CDf values for all observations.
- Mark as New
- Bookmark
- Subscribe
- Mute
- RSS Feed
- Permalink
- Report Inappropriate Content
I am probably missing something.
I run the following code and it makes a nice CDF plot:
ods table cdfplot = want;;
proc univariate data = CombineScoredTemp;
var Predicted_SLR;
cdfplot Predicted_SLR;
run;
quit;
But it does not add the percentiles to the data file.
Plus, I receive a warning saying that the CDFPlot was not created. I am sure that both of these are related, somehow.
I am pretty sure I just mis-read the supplied code or something. But I am currently lost.
I especially am interested in setting this right as I recently read an article on the web very much trashing the PERCENTRANK() procedure in Excel.
Thank you, as usual.
- Mark as New
- Bookmark
- Subscribe
- Mute
- RSS Feed
- Permalink
- Report Inappropriate Content
the ods statement before the proc should store the values in a new table called want.
- Mark as New
- Bookmark
- Subscribe
- Mute
- RSS Feed
- Permalink
- Report Inappropriate Content
Depending on SAS version you may need to turn ODS Graphics on; to see plot.

- Mark as New
- Bookmark
- Subscribe
- Mute
- RSS Feed
- Permalink
- Report Inappropriate Content
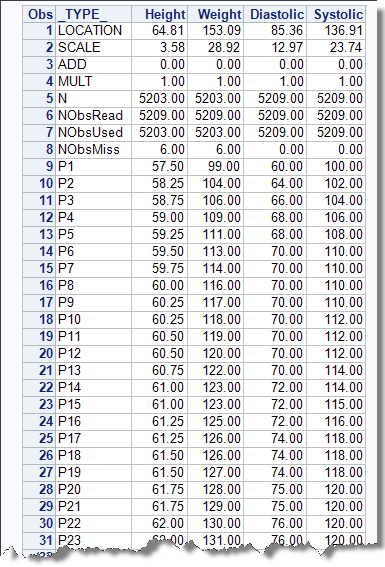
var height weight diastolic systolic;
run;
- Mark as New
- Bookmark
- Subscribe
- Mute
- RSS Feed
- Permalink
- Report Inappropriate Content
What do you think of the following for my solution?
proc rank data = CombineScoredTemp groups = 100000000 out = CombineScoredTemp;
var Predicted_SLR;
ranks PERCENTILE_SLR;
run;
data CombineScoredTemp;
set CombineScoredTemp;
PERCENTILE_SLR = PERCENTILE_SLR / 1000000;
run;
Only problem I see is that it is limited to 6 decimal places. Maybe 7.
- Mark as New
- Bookmark
- Subscribe
- Mute
- RSS Feed
- Permalink
- Report Inappropriate Content
I thought you wanted to compute the percentiles for Predicted_SLR that can be done in a number of ways in SAS PROC STDIZE being a pretty easy method.
Your PROC RANKS GROUPS=100 is similar in that it groups the observations into "percentile groups". The computed RANK that you named PERCENTILE_SLR in the RANK statement is not the percentile "value" as computed by PROC STDIZE.
Am I understanding correctly?
- Mark as New
- Bookmark
- Subscribe
- Mute
- RSS Feed
- Permalink
- Report Inappropriate Content
This method does not account for ties. If you have no ties or don't care you can more easily calculate your 'percentiles' using a data step.
.jpg")
Catch up on SAS Innovate 2026
Nearly 200 sessions are now available on demand in the Innovate Hub.
Watch Now →Learn the difference between classical and Bayesian statistical approaches and see a few PROC examples to perform Bayesian analysis in this video.

Find more tutorials on the SAS Users YouTube channel.
SAS Training: Just a Click Away
Ready to level-up your skills? Choose your own adventure.
-
12 replies
-
12-17-2014 04:16 PM
-
7823 views
-
8 likes
-
5 in conversation
-
