- Home
- /
- Programming
- /
- SAS Procedures
- /
- Re: How to create a frequency table from multiple variables
- RSS Feed
- Mark Topic as New
- Mark Topic as Read
- Float this Topic for Current User
- Bookmark
- Subscribe
- Mute
- Printer Friendly Page

- Mark as New
- Bookmark
- Subscribe
- Mute
- RSS Feed
- Permalink
- Report Inappropriate Content
Hi,
I am in need of some assistance here. I am trying to create a dataset with frequencies, as mapped over several variables/attributes.
My 'have' set is as follows:
data have;
     input ID a b c d e f END;
cards;
1 X X X Y X Z K
922 X Y Y Z Y X K
33 W Z Y Y X X K
12 X X W W X Y F
;
run;
The value domain of each variable/attribute a .. f is the same.
From this dataset 'have' I wish to create a new set where each variable is the frequency of that value in 'have'.
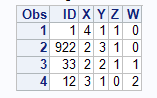
For instance, if we are to use the above dataset 'have', the resultant 'want' is:
data want;
     input ID X Y Z W END;
cards;
1 4 1 1 0 K
922 2 3 1 0 K
33 2 2 1 1 K
12 3 1 0 2 F
;
run;
Can you give me some suggestions on how to accomplish this feat?
Accepted Solutions

- Mark as New
- Bookmark
- Subscribe
- Mute
- RSS Feed
- Permalink
- Report Inappropriate Content
Your input data with replicates represented in variables only serves to obfuscate the true task. I would relieve the burden posed by variables a--f and concentrate on their values.
input ID (a b c d e f END)(:$1.);
cards;
1 X X X Y X Z K
922 X Y Y Z Y X K
33 W Z Y Y X X K
12 X X W W X Y F
;;;;
run;
proc transpose data=have out=have2;
by id notsorted;
var a--f;
run;
proc summary data=have2 nway completetypes order=data;
class id col1;
output out=counts;
run;
proc transpose data=counts out=want(drop=_:);
by id notsorted;
id col1;
var _freq_;
run;

- Mark as New
- Bookmark
- Subscribe
- Mute
- RSS Feed
- Permalink
- Report Inappropriate Content
Hi,
data have;
infile datalines dlm="," missover;
input id a $ b $ c $ d $ e $ f $ END $;
datalines;
1,X,X,X,Y,X,Z,K
922,X,Y,Y,Z,Y,X,K
33,W,Z,Y,Y,X,X,K
12,X,X,W,W,X,Y,F
;
run;
data want (keep=id res1-res4 end);
set have;
array cols{6} a b c d e f;
array res{4} 8. (0,0,0,0);
array test{4} $20. ('X','Y','Z','W');
do i=1 to 4;
do j=1 to 6;
if cols{j}=test{i} then res{i}=sum(res{i},1);
end;
end;
run;
- Mark as New
- Bookmark
- Subscribe
- Mute
- RSS Feed
- Permalink
- Report Inappropriate Content
Thank you very much.
The procedure you listed did unfortunately count not only the individual frequencies, but accumulated them in each subsequent observation. It did however prove very helpful in showing me how it could be done. So thank you.

- Mark as New
- Bookmark
- Subscribe
- Mute
- RSS Feed
- Permalink
- Report Inappropriate Content
data want (keep=ID X Y Z W);
set have;
array field {*} a b c d e f;
X = 0; Y = y; Z = 0; W = 0;
do i = 1 to 6;
select (field{i});
when ('X') X = X + 1;
when ('Y') Y = Y + 1;
when ('Z') Z = Z + 1;
when ('W') W = W + 1;
end;
end;
run;
- Mark as New
- Bookmark
- Subscribe
- Mute
- RSS Feed
- Permalink
- Report Inappropriate Content
This was a great way to do it I think. There was however an issue with counting, as expanding on your solution caused some errors regarding 'conversion from integer to character', though it is probable that this was due to my understanding rather than any irregularity in the procedure.
Thank you for the great answer.
- Mark as New
- Bookmark
- Subscribe
- Mute
- RSS Feed
- Permalink
- Report Inappropriate Content
Your input data with replicates represented in variables only serves to obfuscate the true task. I would relieve the burden posed by variables a--f and concentrate on their values.
input ID (a b c d e f END)(:$1.);
cards;
1 X X X Y X Z K
922 X Y Y Z Y X K
33 W Z Y Y X X K
12 X X W W X Y F
;;;;
run;
proc transpose data=have out=have2;
by id notsorted;
var a--f;
run;
proc summary data=have2 nway completetypes order=data;
class id col1;
output out=counts;
run;
proc transpose data=counts out=want(drop=_:);
by id notsorted;
id col1;
var _freq_;
run;
- Mark as New
- Bookmark
- Subscribe
- Mute
- RSS Feed
- Permalink
- Report Inappropriate Content
This worked right off the bat. Excellent and elegant answer. Thank you for the help.
.jpg")
Catch up on SAS Innovate 2026
Nearly 200 sessions are now available on demand with the SAS Innovate Digital Pass.
Explore Now →Learn the difference between classical and Bayesian statistical approaches and see a few PROC examples to perform Bayesian analysis in this video.

Find more tutorials on the SAS Users YouTube channel.
SAS Training: Just a Click Away
Ready to level-up your skills? Choose your own adventure.
-
6 replies
-
10-23-2014 07:44 AM
-
4220 views
-
6 likes
-
4 in conversation
-
