- Home
- /
- Programming
- /
- SAS Procedures
- /
- Re: How to calculate sum across a row?
- RSS Feed
- Mark Topic as New
- Mark Topic as Read
- Float this Topic for Current User
- Bookmark
- Subscribe
- Mute
- Printer Friendly Page

- Mark as New
- Bookmark
- Subscribe
- Mute
- RSS Feed
- Permalink
- Report Inappropriate Content
Hi,
How to calculate sum across a row?
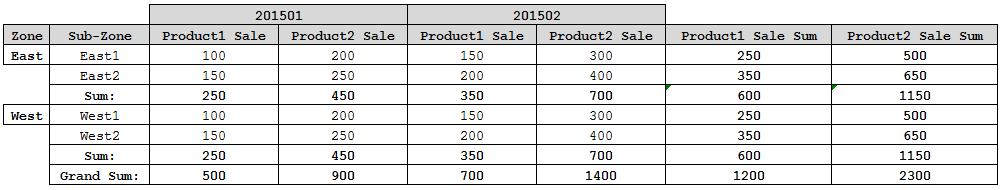
Like in below example I want to create two columns "Product1 Sale Sum" and "Product2 Sale Sum" which is the sum of Product1 and Product2 Sales in reporting months!!
I am using "Proc report" to create this report.
Any suggestion will be much appreciated.
Thanks in advance!!
Accepted Solutions

- Mark as New
- Bookmark
- Subscribe
- Mute
- RSS Feed
- Permalink
- Report Inappropriate Content
You use a compute block on the selected columns. See my paper on
Proc Report at www2.sas.com/proceedings/forum2008/079-2008.pdf.
Dave Lewandowski
data sales;
input zone $ sub_zone $ sale_month $ product $ sales;
datalines;
East East1 201501 Product1 100
East East2 201501 Product1 150
East East1 201502 Product1 150
East East2 201502 Product1 200
West West1 201501 Product1 100
West West2 201501 Product1 150
West West1 201502 Product1 150
West West2 201502 Product1 200
East East1 201501 Product2 200
East East2 201501 Product2 250
East East1 201502 Product2 300
East East2 201502 Product2 400
West West1 201501 Product2 200
West West2 201501 Product2 250
West West1 201502 Product2 300
West West2 201502 Product2 400
;
proc report data=sales missing headline;
column zone sub_zone sale_month,product,sales prod1sum prod2sum;
define zone / group width= 10 'Zone';
define sub_zone / group width= 10 'Sub-Zone';
define sale_month / across '';
define product / across '';
define sales / analysis sum format=4.0 '';
define prod1sum / computed 'Product 1 Sum';
define prod2sum / computed 'Product 2 Sum';
break after zone / ol skip summarize suppress;
rbreak after / dol summarize;
compute prod1sum;
prod1sum = sum(_C3_,_C5_);
endcompute;
compute prod2sum;
prod2sum = sum(_C4_,_C6_);
endcompute;
run;
201501 201502
Prod Prod Prod Prod
uct1 uct2 uct1 uct2 Product Product
Zone Sub-Zone 1 Sum 2 Sum
--------------------------------------------------------------------
East East1 100 200 150 300 250 500
East2 150 250 200 400 350 650
---- ---- ---- ---- --------- ---------
250 450 350 700 600 1150
West West1 100 200 150 300 250 500
West2 150 250 200 400 350 650
---- ---- ---- ---- --------- ---------
250 450 350 700 600 1150
==== ==== ==== ==== ========= =========
500 900 700 1400 1200 2300
- Mark as New
- Bookmark
- Subscribe
- Mute
- RSS Feed
- Permalink
- Report Inappropriate Content
I am using following sample data and code to create my report:

proc report data=work.tempdata;
column Zone SubZone SaleMonth, (Product1Sale Product2Sale);
define zone / group;
define subzone/group;
define salemonth/across '';
define product1sale/analysis;
define product2sale/analysis;
break after zone / summarize;
compute after zone;
zone='';
subzone="Sum:";
endcomp;
rbreak after / summarize;
compute after;
zone='';
subzone="Grand Sum:";
endcomp;
run;
quit;

- Mark as New
- Bookmark
- Subscribe
- Mute
- RSS Feed
- Permalink
- Report Inappropriate Content
This might not be helpful at all but what I would do is get the sums that you want in a previous step:
data have;
input zone $ sub $ month sale1 sale2;
cards;
east east1 201501 100 200
east east2 201501 150 250
east east1 201502 150 300
east east2 201502 200 400
west west1 201501 100 200
west west2 201501 150 250
west west1 201502 150 300
west west2 201502 200 400
;
run;
proc sql;
create table want as
select *,sum(sale1) as sum_sale1,sum(sale2) as sum_sale2
from have
group by zone,sub;
From there you'll have all the information you need for your proc report.
- Mark as New
- Bookmark
- Subscribe
- Mute
- RSS Feed
- Permalink
- Report Inappropriate Content
I know this is not a best way of achieving this but following code does what I want. ![]()
But still I am looking for some way to achieve this directly from "Proc Report" ![]()
/**** Calculate Sum in a seperate dataset*/
PROC SQL;
CREATE TABLE WORK.QUERY_FOR_TEMPDATA AS
SELECT t1.Zone,
t1.SubZone,
(sum(t1.Product1Sale)) AS Product1SaleSum,
(sum(t1.Product2Sale)) AS Product2SaleSum
FROM WORK.TEMPDATA t1
GROUP BY t1.Zone,
t1.SubZone;
QUIT;
/**** Join that dataset with original dataset*/
PROC SQL;
CREATE TABLE WORK.TempDataMod AS
SELECT t2.Zone,
t2.SubZone,
t2.SaleMonth,
t2.Product1Sale,
t2.Product2Sale,
t1.Product1SaleSum,
t1.Product2SaleSum
FROM WORK.QUERY_FOR_TEMPDATA t1
RIGHT JOIN WORK.TEMPDATA t2 ON (t1.Zone = t2.Zone) AND (t1.SubZone = t2.SubZone)
ORDER BY t2.Zone,
t2.SubZone,
t2.SaleMonth;
QUIT;
/**** Use this new modified data set for reporting*/
proc report data=work.TempDataMod;
column Zone SubZone SaleMonth, (Product1Sale Product2Sale) Product1SaleSum Product2SaleSum ;
define zone / group;
define subzone/group;
define salemonth/across '';
define product1sale/analysis;
define product2sale/analysis;
define Product1SaleSum/group;
define Product2SaleSum/group;
break after zone / summarize;
compute after zone;
zone='';
subzone="Sum:";
endcomp;
rbreak after / summarize;
compute after;
zone='';
subzone="Grand Sum:";
endcomp;
run;
quit;

- Mark as New
- Bookmark
- Subscribe
- Mute
- RSS Feed
- Permalink
- Report Inappropriate Content
Can you use proc tabulate instead of proc report?

- Mark as New
- Bookmark
- Subscribe
- Mute
- RSS Feed
- Permalink
- Report Inappropriate Content
Unfortunately , you have to use option OUT= to check the exact name of those columns:
proc report ....... out=xxxx ;
Open xxxx and see what name they are , they may like _Cxx_ ...
after that . build a compute column to sum them all.
compute xx;
xx=sum(_Cxx_,_Cxx_.....); /*not sure if it would work too . sum(of _: ) */
endcomp;
Xia Keshan
- Mark as New
- Bookmark
- Subscribe
- Mute
- RSS Feed
- Permalink
- Report Inappropriate Content
You use a compute block on the selected columns. See my paper on
Proc Report at www2.sas.com/proceedings/forum2008/079-2008.pdf.
Dave Lewandowski
data sales;
input zone $ sub_zone $ sale_month $ product $ sales;
datalines;
East East1 201501 Product1 100
East East2 201501 Product1 150
East East1 201502 Product1 150
East East2 201502 Product1 200
West West1 201501 Product1 100
West West2 201501 Product1 150
West West1 201502 Product1 150
West West2 201502 Product1 200
East East1 201501 Product2 200
East East2 201501 Product2 250
East East1 201502 Product2 300
East East2 201502 Product2 400
West West1 201501 Product2 200
West West2 201501 Product2 250
West West1 201502 Product2 300
West West2 201502 Product2 400
;
proc report data=sales missing headline;
column zone sub_zone sale_month,product,sales prod1sum prod2sum;
define zone / group width= 10 'Zone';
define sub_zone / group width= 10 'Sub-Zone';
define sale_month / across '';
define product / across '';
define sales / analysis sum format=4.0 '';
define prod1sum / computed 'Product 1 Sum';
define prod2sum / computed 'Product 2 Sum';
break after zone / ol skip summarize suppress;
rbreak after / dol summarize;
compute prod1sum;
prod1sum = sum(_C3_,_C5_);
endcompute;
compute prod2sum;
prod2sum = sum(_C4_,_C6_);
endcompute;
run;
201501 201502
Prod Prod Prod Prod
uct1 uct2 uct1 uct2 Product Product
Zone Sub-Zone 1 Sum 2 Sum
--------------------------------------------------------------------
East East1 100 200 150 300 250 500
East2 150 250 200 400 350 650
---- ---- ---- ---- --------- ---------
250 450 350 700 600 1150
West West1 100 200 150 300 250 500
West2 150 250 200 400 350 650
---- ---- ---- ---- --------- ---------
250 450 350 700 600 1150
==== ==== ==== ==== ========= =========
500 900 700 1400 1200 2300
.jpg")
Catch up on SAS Innovate 2026
Nearly 200 sessions are now available on demand in the Innovate Hub.
Watch Now →Learn the difference between classical and Bayesian statistical approaches and see a few PROC examples to perform Bayesian analysis in this video.

Find more tutorials on the SAS Users YouTube channel.
SAS Training: Just a Click Away
Ready to level-up your skills? Choose your own adventure.
-
6 replies
-
04-22-2015 10:52 AM
-
8365 views
-
3 likes
-
5 in conversation
-
