- Home
- /
- Programming
- /
- SAS Procedures
- /
- How can I create a multi-variable table with Frequency?
- RSS Feed
- Mark Topic as New
- Mark Topic as Read
- Float this Topic for Current User
- Bookmark
- Subscribe
- Mute
- Printer Friendly Page
- Mark as New
- Bookmark
- Subscribe
- Mute
- RSS Feed
- Permalink
- Report Inappropriate Content
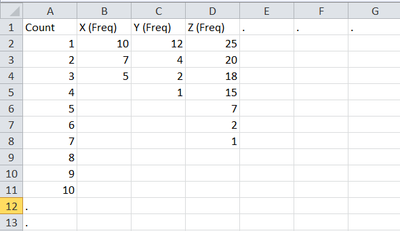
I have 10 variables with count data, I want to create a matrix something like this.
Each variable has unequal frequency distribution. I used PROC FREQ but it gives output for each variable but not matrix. Can someone help me with this?
Thanks
- Mark as New
- Bookmark
- Subscribe
- Mute
- RSS Feed
- Permalink
- Report Inappropriate Content
I think you need to revisit your plan. Couldn't multiple values of X have the same COUNT?
**********************************************************
OK, I take it back. I think I see what you are after. But I don't see a one-step process to get it. Is a multi-step process permitted?
**********************************************************
Taking it back again ... if your data is in the right form, you could use:
proc tabulate data=have;
class count;
var x y z;
tables count, n * (x y z);
run;
Many features are available to customize the table.
- Mark as New
- Bookmark
- Subscribe
- Mute
- RSS Feed
- Permalink
- Report Inappropriate Content
The first variable in the picture is supposed to me "Value" instead of "Count", my mistake.
The values under X are count frequency, so each value is unique. It is read as "With value 1 there are 10 X, 12 Y and 25 Y, With value 2 there are 10 X, 12 Y and 25 Y...so on"
- Mark as New
- Bookmark
- Subscribe
- Mute
- RSS Feed
- Permalink
- Report Inappropriate Content
Yes, it took me a minute to realize that you had the frequencies already calculated.
It would help if you could show 3 or 4 observations from the incoming data.
You can probably use the program I already posted, using VALUE instead of COUNT.
- Mark as New
- Bookmark
- Subscribe
- Mute
- RSS Feed
- Permalink
- Report Inappropriate Content
I didn't include the names of the varibales here, so imagine each separation is a variable with some name.

- Mark as New
- Bookmark
- Subscribe
- Mute
- RSS Feed
- Permalink
- Report Inappropriate Content
Instrunctions at: https://communities.sas.com/t5/SAS-Communities-Library/How-to-create-a-data-step-version-of-your-dat... show how to create datastep code that you can paste here to show what your data (example or dummy) actually looks like. Then we can actually run the code to have a dataset with the same characteristics and test code.
Pictures, especially without variable names and such aren't extremely helpful.
And is that example data supposed to generate the desired output shown in the first post? If not, what is the desired output for the shown data?
I suspect something like this may be what you are looking for:
proc tabulate data= have;
   class value;
   var x y z;
   table value,
         (x y z)*n /* or sum your example input and output data don't really match*/;
end;
- Mark as New
- Bookmark
- Subscribe
- Mute
- RSS Feed
- Permalink
- Report Inappropriate Content
Sorry, I can't give the variable names. The second picture each column can be represented as X, Y, Z etc.
The first picture is the final output I want to have.
Thanks
Learn the difference between classical and Bayesian statistical approaches and see a few PROC examples to perform Bayesian analysis in this video.
Find more tutorials on the SAS Users YouTube channel.
SAS Training: Just a Click Away
Ready to level-up your skills? Choose your own adventure.


