- Home
- /
- Programming
- /
- SAS Procedures
- /
- Re: Help with a model
- RSS Feed
- Mark Topic as New
- Mark Topic as Read
- Float this Topic for Current User
- Bookmark
- Subscribe
- Mute
- Printer Friendly Page

- Mark as New
- Bookmark
- Subscribe
- Mute
- RSS Feed
- Permalink
- Report Inappropriate Content
Hello everyone,
I am working on a large database (5GB) of investors' portfolio holdings trying to implement a model. The first step is to calculate a fraction of the investors that are buyers, or else the Raw fraction of funds buying security k during month t (RawΔ"k,t " 😞
RawΔ"k,t "= (Number of funds buying security k during month t) / (Number of funds buying security k during month t + Number of funds selling security k during month t)
I can calculate this fraction for each stock seperately but there are thousands of them. Is there anyway to do it at once, having one table with the fraction of each stock every month?
Here is the code I am using to do it for each stock:
proc sql; create table work.aa as select* from tmp2.example
where ticker= "AA";
quit;
proc sort data=aa out=new;
by ticker date sign mgrno;run;
PROC MEANS DATA=new NWAY noprint;
CLASS ticker;
VAR mgrno;
by date sign;
OUTPUT OUT=new2 N=cnt;
RUN;
data new3; set new2; where sign ne "0"; drop type freq; run;
data buy (rename=(cnt=buy) drop=sign);set new3; where sign eq "+"; run;
data sell (rename=(cnt=sell)drop=sign);set new3; where sign eq "-"; run;
proc sql; create table fraction as select* from buy as a left join sell as b on a.date=b.date and a.ticker=b.ticker;quit;
proc sql; create table final as select*,buy/(buy+sell) as fraction from fraction;quit;
I am attaching a small sample of the data and an excel file showing how I used to do that that in excel (I also have to standardize this fraction)
Many thanks in advance

- Mark as New
- Bookmark
- Subscribe
- Mute
- RSS Feed
- Permalink
- Report Inappropriate Content
How about something simple like this:
proc sql;
create table fraction as
select
ticker,
intnx("MONTH",date,0) as month format=yyqd6.,
sum(sign="+")/(sum(sign="+")+sum(sign="-")) as fraction
from sasforum.CostaSg_05_2013
group by ticker, calculated month;
reset outobs=20;
select * from fraction;
quit;
PG
- Mark as New
- Bookmark
- Subscribe
- Mute
- RSS Feed
- Permalink
- Report Inappropriate Content
That was awesome PGStats! Thanks!
The next step was to standardize this fraction which I did as following:
proc means data=fraction mean std nway noprint;
var fraction;
class month;
output out=want (drop=_:)
mean= std= /autoname;
run;
proc sql; create table have as
select* from fraction as a left join want as b on a.month=b.month;quit;
proc sql; create table need as select*,(fraction-fraction_Mean)/fraction_StdDEv as Standard_Fraction from have;quit;
I am attaching the file. Now the next step is the following:
For each quarter I need to run a cross-sectional (across securities) regression of the standardized fraction of investors buying security κ (Δκ,τ) in the current quarter on the standardized fraction of investors buying security κ the previous quarter (Δκ,τ-1).
So, we have this model: Δκ,τ = βΔκ,τ-1 + ε
So for each month, I would like to have one column with the β coefficient, one column with the R2 and one column with Adj. R2.
Any ideas on that?
- Mark as New
- Bookmark
- Subscribe
- Mute
- RSS Feed
- Permalink
- Report Inappropriate Content
Do you mean something like this:
proc sql;
create table fraction as
select
ticker,
intnx("QTR",date,0) as qtr format=yyqd7.,
sum(sign="+")/(sum(sign="+")+sum(sign="-")) as fraction
from sasforum.CostaSg_05_2013
group by calculated qtr, ticker
order by calculated qtr, ticker;
quit;
proc stdize data=fraction out=stdFraction sprefix=std;
by qtr;
var fraction;
run;
proc sql;
create table stdFrac2t as
select
A.ticker,
A.qtr,
A.stdFraction,
B.stdFraction as prevFraction
from
stdFraction as A inner join
stdFraction as B on A.ticker=B.ticker and intnx("QTR", A.qtr, -1)=B.qtr
order by qtr, ticker;
quit;
proc reg data=stdFrac2t outest=fracReg edf plots=none;
by qtr;
model stdFraction = prevFraction;
run;
The regression estimates and rsquares are in dataset fracReg. You don't need adjusted rsquare when estimating a single parameter (and an intercept).
PG

- Mark as New
- Bookmark
- Subscribe
- Mute
- RSS Feed
- Permalink
- Report Inappropriate Content
PG. I think it is a time serial data. Your REG model is not appropriate .
REG model assumed Δκ,τ and βΔκ,τ-1 are independent . But they are time serial data which means they are relational .
OP should post it at time-serial analysis forum .there are an expert named Udo will give you some advice .
Ksharp
- Mark as New
- Bookmark
- Subscribe
- Mute
- RSS Feed
- Permalink
- Report Inappropriate Content
Many thanks PGStats and Ksarp for your comment!
I am not familiar with the regressions in SAS and whether this is the correct specification of the model. However, the model should not have an intercept. It is an autoregressive model of order 1.
So I guess I should include / noint in the proc reg.
- Mark as New
- Bookmark
- Subscribe
- Mute
- RSS Feed
- Permalink
- Report Inappropriate Content
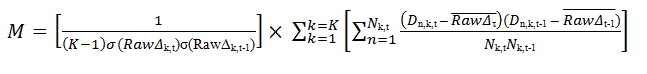
Now the final step of the model is this one:

where
K is the number of securities
σ(RawΔκ,t) is the cross-sectional standard deviation of the raw fraction of investors buying the security k in quarter t
σ(RawΔκ,t-1) is the cross-sectional standard deviation of the raw fraction of investors buying the security k in quarter t-1
RawΔκ,t bar is the cross-sectional average raw fraction of institutions buying in quarter t
RawΔκ,t-1 bar is the cross-sectional average raw fraction of institutions buying in quarter t-1
Dn,k,t is a dummy variable taking the value of one when investor n is a buyer of security k in quarter t and zero when fund n is a seller of security k in quarter t (in the example database a buyer is indicated as + and a seller as -)
Nk,t is the number of investors actively trading security k in quarter t
Any thoughts on this?
- Mark as New
- Bookmark
- Subscribe
- Mute
- RSS Feed
- Permalink
- Report Inappropriate Content
Yes. I know. It is time-serial data analysis.
Why not post it at SAS Forecasting and Econometrics
- Mark as New
- Bookmark
- Subscribe
- Mute
- RSS Feed
- Permalink
- Report Inappropriate Content
I have post it there as well Ksarp, thanks.
But yes, the model must not be correct as I run some regressions manually and I got different results.
This is what PGStats initially wrote:
proc reg data=have outest=need edf plots=none;
by qtr;
model Fraction = prevFraction / noint;
run;
Based on the file (Have), the results are in the attached file (need)
I tried to check whether the results are correct. So, I did the process step-by-step. I only used the first 2 quarters 1980-N4 and 1981-N1 (deleting missing values) to see if I will get the same results (the dependent variable is the 1981_N1 and the independent is the 1980-N4); I attach the file (Test). If we run a regression in this file the results are actually different (attached file correct).
proc reg data=have outest=need edf plots=none;
model _1981N1 = _1980N4 / noint;
run;
- Mark as New
- Bookmark
- Subscribe
- Mute
- RSS Feed
- Permalink
- Report Inappropriate Content
Hi. Here are almost nobody has time-serial data analysis experience at this forum.
Although I major in economic and finance, I have little time to learn these statistical knowledge.
at forum SAS Forecasting and Econometrics
there is an expert at this field named udo@sas
You can ask him .
- Mark as New
- Bookmark
- Subscribe
- Mute
- RSS Feed
- Permalink
- Report Inappropriate Content
Actually,
What PGstats wrote about the model is correct! The wrong part is this one:
proc sql;
create table stdFrac2t as
select
A.ticker,
A.qtr,
A.stdFraction,
B.stdFraction as prevFraction
from
stdFraction as A inner join
stdFraction as B on A.ticker=B.ticker and intnx("QTR", A.qtr, -1)=B.qtr
order by qtr, ticker;
quit;
The problem is that it does not calculate correctly the previous fraction. The first couple of stocks are correct but then it is mixed up. Maybe because some stocks are not traded during some quarters.
So, any ideas how this can be solved?
- Mark as New
- Bookmark
- Subscribe
- Mute
- RSS Feed
- Permalink
- Report Inappropriate Content
HI, I looked at the results sommarily and didn't find anything wrong. Can you give an example (ticker, quarter) that is mixed up in the results of that query?
- Mark as New
- Bookmark
- Subscribe
- Mute
- RSS Feed
- Permalink
- Report Inappropriate Content
Hi PGStats,
For example AAPL, in 1981-1 the fraction is 0.7142857143 (the previous fraction is correct)
whereas in 1981-2 the fraction is 0.8222222 and the previous fraction is 0.295080909 (whereas it should be 0.7142857143)
- Mark as New
- Bookmark
- Subscribe
- Mute
- RSS Feed
- Permalink
- Report Inappropriate Content
You are confusing the fractions and the standardized fractions. PrevFraction is the previous standardized fraction. Here is what I get for AAPL :
TICKER qtr fraction stdfraction prevFraction
----------------------------------------------------
AAPL 1980-4 1 1.292816 .
AAPL 1981-1 0.714286 0.295081 1.292816
AAPL 1981-2 0.822222 0.678854 0.295081
AAPL 1981-3 0.636364 0.083371 0.678854
AAPL 1981-4 0.723404 0.313684 0.083371
AAPL 1982-1 0.622642 0.020717 0.313684
AAPL 1982-2 0.560976 -0.31263 0.020717
- Mark as New
- Bookmark
- Subscribe
- Mute
- RSS Feed
- Permalink
- Report Inappropriate Content
PGStats you are right! Many thanks!
The problem was that when i standardized the fraction using:
proc stdize data=fraction out=stdFraction sprefix=std;
by qtr;
var fraction;
run;
I got this error (i don't know why this didn't work):
proc stdize data=fraction out=stdFraction sprefix=std;
                                                             -------
                                                              22
                                                              76
ERROR 22-322: Syntax error, expecting one of the following: ;, (, ADD, DATA, EXTREME, FUZZ,
              INITIAL, KEEPLEN, MAXITER, METHOD, MISSING, MULT, NMARKERS, NOMISS, NORM, OUT,
              OUTSTAT, PCTLDEF, PCTLMTD, PCTLPTS, PMARKERS, PRINT, PSTAT, QMARKERS, REPLACE,
              REPONLY, SNORM, UNSTD, UNSTDIZE, VARDEF.
ERROR 76-322: Syntax error, statement will be ignored.
147  by qtr;
148  var fraction;
149  run;

NOTE: The SAS System stopped processing this step because of errors.
NOTE: PROCEDURE STDIZE used (Total process time):
      real time           0.00 seconds
      cpu time            0.01 seconds
So I skipped that and then made a mistake when changed the names in the next query.
The next step is to calculate expression M (as shown above)
For the first term I have this code:
proc freq data= tmp1.example;
tables date / out=K noprint;
run;
proc sql;
create table K1 as
select date, count,
intnx("QTR",date,0) as qtr format=yyqd7.,count-1 as K_1
from K ;
quit;
proc means data=fraction mean std nway noprint;
var fraction;
class qtr;
output out=want (drop=_:) mean= std= /autoname;
run;
data a3;
set want;
set K1 (keep=K_1);
frmean_1= lag(fraction_mean);
frstddev_1=lag(fraction_stddev);
run;
data a4;
set a3;
coefficient= 1/(k_1*fraction_stddev*frstddev_1);
run;
Do you have any suggestions on making this shorter?
Many thanks for your time!
.jpg")
Catch up on SAS Innovate 2026
Nearly 200 sessions are now available on demand in the Innovate Hub.
Watch Now →Learn the difference between classical and Bayesian statistical approaches and see a few PROC examples to perform Bayesian analysis in this video.

Find more tutorials on the SAS Users YouTube channel.
SAS Training: Just a Click Away
Ready to level-up your skills? Choose your own adventure.
-
18 replies
-
05-11-2013 01:52 PM
-
5790 views
-
0 likes
-
3 in conversation
-
