Hey, I'm using the ODS and the Msoffice2k_x tagset to generate an excel report but I'm getting a lot of additional information when I try to output a plot. I only want the plot and not the additional lines of text information and data that the procedure is generating. Is it possible to turn all of that off?
 ,
,
ods tagsets.msoffice2k_x file="...."
options(panelcols="2") style=normal;
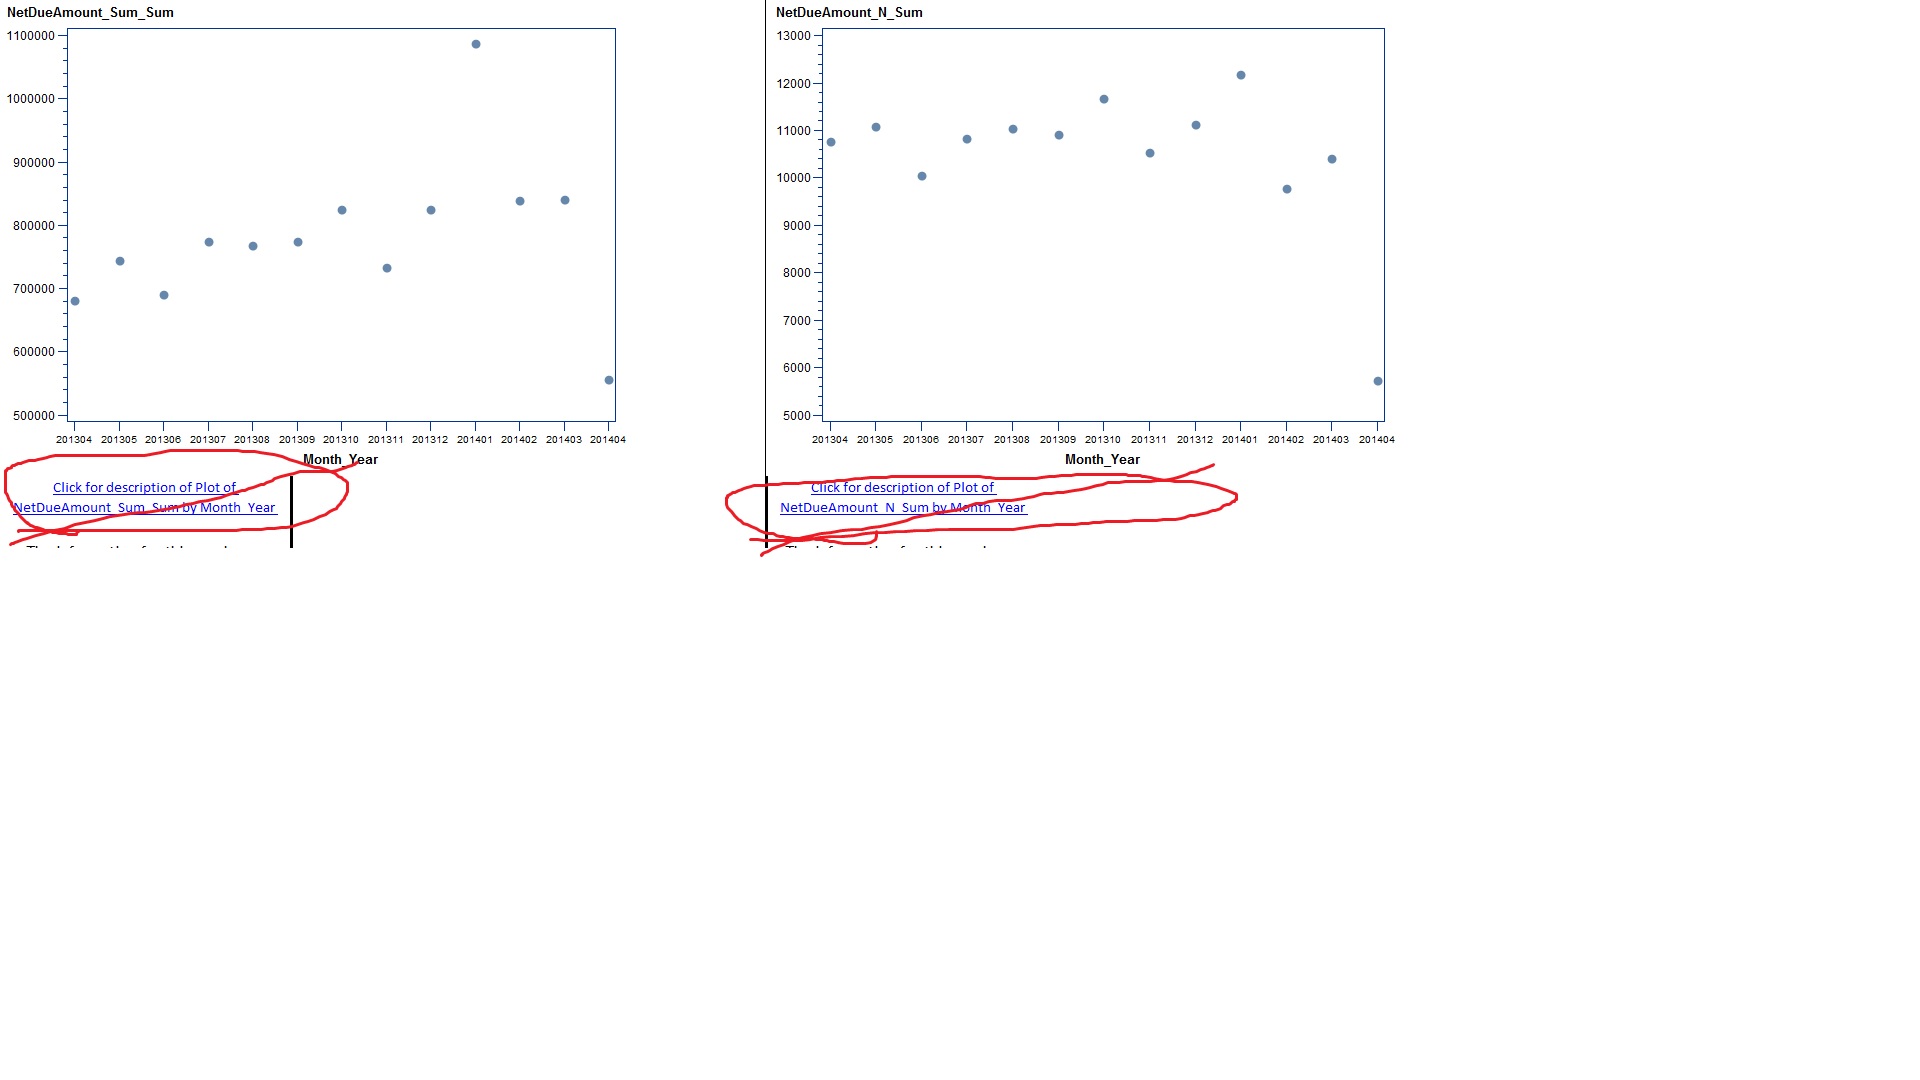
PROC GPLOT DATA=only_13_months NOCACHE ;
PLOT NetDueAmount_Sum_Sum * Month_Year / VAXIS=AXIS1 HAXIS=AXIS2 FRAME ;
BY ContractNo;
where ContractNo = 'H8991';
RUN;
PROC GPLOT DATA=only_13_months NOCACHE ;
PLOT NetDueAmount_N_Sum * Month_Year / VAXIS=AXIS1 HAXIS=AXIS2 FRAME;
BY ContractNo;
where ContractNo = 'H8991';
RUN;
ods tagsets.msoffice2k_x close;


.jpg")

