- Home
- /
- Programming
- /
- SAS Procedures
- /
- Re: Generate GRAPH
- RSS Feed
- Mark Topic as New
- Mark Topic as Read
- Float this Topic for Current User
- Bookmark
- Subscribe
- Mute
- Printer Friendly Page

- Mark as New
- Bookmark
- Subscribe
- Mute
- RSS Feed
- Permalink
- Report Inappropriate Content
Hi all,
I am very new to creating graphs ,can any one of you please guide, as which procedures to use ,to generate the below graph.
Please guide me.
Thanks,
Mahesh P

- Mark as New
- Bookmark
- Subscribe
- Mute
- RSS Feed
- Permalink
- Report Inappropriate Content
Hi:
Several methods are possible: SAS/GRAPH and PROC GPLOT; ODS GRAPHICS and PROC SGPLOT (with a Series statement or a VLINE statement, depending on your data); or the ODS GRAPHICS designer; or the Enterprise Guide Graph Wizard; or Graph Template Language.
The most appropriate forum for this question is the Graph forum:
https://communities.sas.com/community/support-communities/sas_graph_and_ods_graphics
However, there are many, many examples of using either PROC GPLOT or PROC SGPLOT in the documentation. I would not venture into the Graph Template Language until you had exhausted what you can do with either PROC GPLOT or PROC SGPLOT. Also, you have to know your data and what structure it is in; what variable is going to represent the X axis and what variable will be used for the Y axis; is the data already structured in a form that is usable by your procedure of choice and what version of SAS you have and whether you are using EG or submitting code in batch mode. Whether you want to use ODS to create output files with the graph, and if so, what is your destination of choice.
My recommendation would be to start with some of the Graph examples on the SAS support site in the doc. Or, alternately, search for some user group papers for beginners on using either SAS/GRAPH or ODS GRAPHICS.
cynthia
- Mark as New
- Bookmark
- Subscribe
- Mute
- RSS Feed
- Permalink
- Report Inappropriate Content
HI Cynthia,
Thanks for your reply, i am very new in generating graphs and as suggested i will try few examples.I am using BASE SAS 9.2 .it's very hard to understand the syntax in PROC GPLOT or PROC SGPLOT.If possible please share few resources where i can easily learn graphs and moreover i am not a statistician.
Thanks for your prompt reply.
Thanks,
Mahesh P

- Mark as New
- Bookmark
- Subscribe
- Mute
- RSS Feed
- Permalink
- Report Inappropriate Content
hi ... try this paper ...
SAS/GRAPH® 101 (Mike Zdeb, Robert Allison)
http://www2.sas.com/proceedings/sugi31/239-31.pdf
perhaps someone will post a link to a similar paper that uses SG
- Mark as New
- Bookmark
- Subscribe
- Mute
- RSS Feed
- Permalink
- Report Inappropriate Content
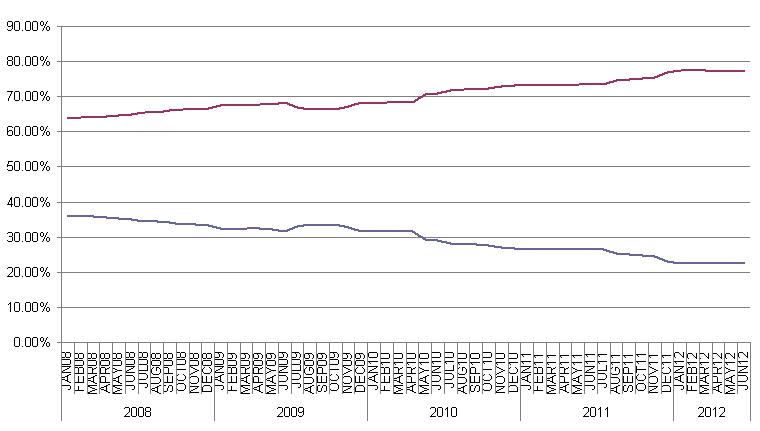
hi ... here's a SAS job that produces the attached chart
it actually produces many plots, adding various changes to the first plot one step at a time until the attached chart is produced
(this is the same approach to learning about SAS/Graph and GPLOT used in the paper I cited in an earlier posting)

- Mark as New
- Bookmark
- Subscribe
- Mute
- RSS Feed
- Permalink
- Report Inappropriate Content
Thanks Mike,for your guidance.
Thanks,
Mahesh P
- Mark as New
- Bookmark
- Subscribe
- Mute
- RSS Feed
- Permalink
- Report Inappropriate Content
Hi:
In addition to the references that Mike's already posted, here's an introduction to ODS GRAPHICS for the non-statistician.
http://support.sas.com/resources/papers/proceedings11/294-2011.pdf
You can use ODS GRAPHICS and the "SG" procedures without being a statistician.
As someone new to SAS, I think that one of the best ways to learn SAS/GRAPH is to use the Graph Wizards inside Enterprise Guide to generate the bulk of your graph code. Then examine the code that's generated by the Graph Wizard and you can zero in on the part of the doc you need to consult. So, you want a bar chart? Examining the code behind the scenes will show you that PROC GCHART was used. Depending on the choices you make in the Wizard, you can see the impact of the change and whether a PATTERNID or AXIS statement was also created based on your choices. Then, if you need to make changes, you can go back through the Wizard again, or you can start from the generated code as a way to understand how to make changes and what impact the code changes have on the output.
Ditto for the ODS GRAPHICS designer. Depending on your version of SAS 9.2, you may not be able to use the ODS GRAPHICS designer yet, but it is equally cool as the EG Graph Wizards, easy to use and also generates code behind the scenes. The difference is that it generates code that uses the ODS GRAPHICS framework to build your images.
If you have a SAS/GRAPH license, then you have the best of both worlds -- you could learn "classic" SAS/GRAPH and there are a ton of resources available on the web with very, very good examples OR you could learn ODS GRAPHICS. There aren't quite as many resources, but there are getting to be more, and there are several books and blogs available for ODS GRAPHICS topics.
How do you decide between the two different ways to create graphs. There's a paper about that, too:
http://support.sas.com/resources/papers/proceedings12/261-2012.pdf
Plus, aside from the award-winning SAS/GRAPH documentation and the excellent samples that are available in the SAS Sample Program library, there are many, many other papers for beginners on the topic of SAS/GRAPH and ODS GRAPHICS. A Google search should net you lots of hits.
cynthia
.jpg")
Catch up on SAS Innovate 2026
Nearly 200 sessions are now available on demand in the Innovate Hub.
Watch Now →Learn the difference between classical and Bayesian statistical approaches and see a few PROC examples to perform Bayesian analysis in this video.

Find more tutorials on the SAS Users YouTube channel.
SAS Training: Just a Click Away
Ready to level-up your skills? Choose your own adventure.
-
6 replies
-
08-04-2012 02:40 PM
-
3549 views
-
0 likes
-
3 in conversation
-
