- Home
- /
- Programming
- /
- SAS Procedures
- /
- From intck('month', b.date, a.date) to intck('day', b.date, a.date), c...
- RSS Feed
- Mark Topic as New
- Mark Topic as Read
- Float this Topic for Current User
- Bookmark
- Subscribe
- Mute
- Printer Friendly Page

- Mark as New
- Bookmark
- Subscribe
- Mute
- RSS Feed
- Permalink
- Report Inappropriate Content
Hi all!
I have a dataset with monthly observations per variable, which I can run perfectly. However, if I want to run the same SAS (9.3) file with daily observations per variable I get stuck. I have dates in the following format: 30NOV1988, 30DEC1988 etc. I think I have to change something with 'year' or 'month' to 'day', but can't figure out what to do. Does anyone have some tips? My command lines that have something to do with the dates are the following:
*** BEGINING SAMPLE PERIOD;
%let begyear=1965;
*** ENDING SAMPLE PERIOD;
%let endyear=1989;
* Additional years of lagged return for portfolio formation and holding;
if (&begyear-2)<=year(date)<=&endyear;
drop lexchcd lshrcd shrcd exchcd;
run;
proc sql;
create table msfx2
as select distinct a.volr, a.date as form_date, a.permno, b.date, b.ret, b.shrout, b.prc, b.ME
from vol2 as a, msex2 as b
where a.permno=b.permno
and 0<intck('month',a.date,b.date)<=&K;
quit;
proc sql;
create table msfx2
as select distinct a.volr, a.date as form_date, a.permno, b.date, b.ret, b.shrout, b.prc, b.ME
from vol2 as a, msex2 as b
where a.permno=b.permno
and 0<intck('month',a.date,b.date)<=&K;
quit;
proc sort data=msfx3; by date volr;
where year(date) between &begyear and &endyear;
run;

- Mark as New
- Bookmark
- Subscribe
- Mute
- RSS Feed
- Permalink
- Report Inappropriate Content
What are you trying to accomplish?
What is &K supposed to represent?
if (&begyear-2)<=year(date)<=&endyear; shouldn't need to change if you are concerned about the year as a boundary. If you want to look at values between given dates then you will need to supply a date literal.
WITHOUT macro code
if "01Jan2014"d <= date <= "15JUL2014"d for example to examine dates within the two specified values. It does not matter how your dates are formatted date literals must be ddMONyy within quotes with the D trailing without a space.
You could use:
%let sdate= 01JAN2014;
and reference as
if "&sdate"d <=
Trying to include the quotes in the macro variables often leads to much more work.
If you want to modify this to get a number of days
0<intck('month',a.date,b.date)<=&K;
then
0<intck('day',a.date,b.date)<=&K;
where year(date) between &begyear and &endyear;
could become
where date between "&sdate"d and "&edate"d; with suitable assignments for Sdate and Edate as above.
If you need to specify a date relative to one then use intck with the date literal.
- Mark as New
- Bookmark
- Subscribe
- Mute
- RSS Feed
- Permalink
- Report Inappropriate Content
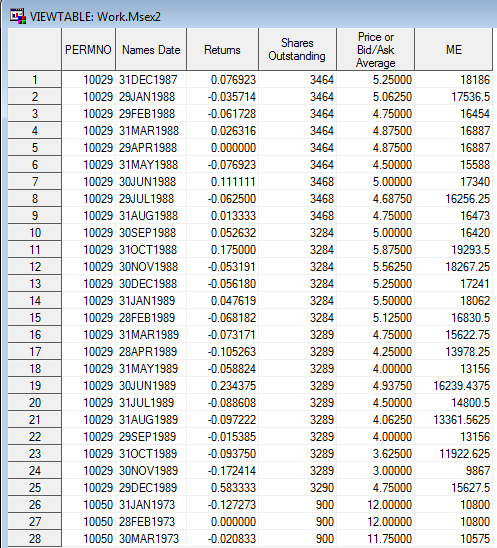
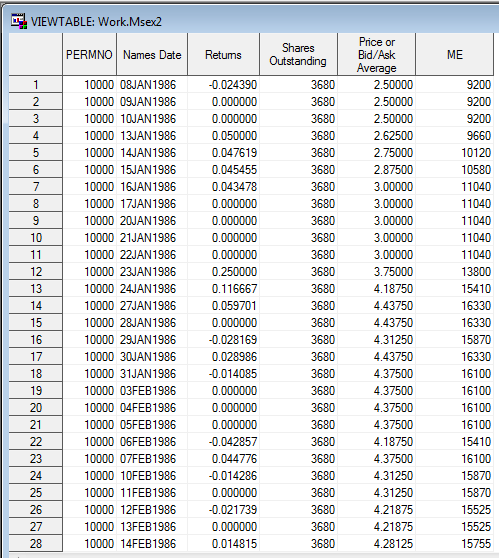
Hi ballardw. Thanks a lot for your reaction! What I try to accomplish is the following: I have a dataset that has monthly observations for the following variables from CRSP (i.e. the database): permno (identifier of the company), date, ret (return) shrout (shares outstanding), prc (price), ME (=shrout*prc), exchcd (exchange code, not shown in attached image) and shrcd (sharecode, not shown in attached image). In my SAS file I create 10 portfolios (i.e. deciles) that are ranked on the standard deviation of the stock returns of the last 12 months. That means that K = 12. Then, I hold those portfolios for 1 month (J = 1) and I rebalance the portfolios after 1 month (see section 4), that is, I create new portfolios which are again held for 1 month etc. However, I want to rewrite my file in such a way that I can calculate the standard deviations of the returns over the past month (i.e. from the first daily observation of the month until the last daily observation of the month, that is around 21 trading days per month) and then hold those portfolios for all the trading days of the next month (i.e. again around 21 trading days, from the first trading day in the month until the last trading day in the month). I've posted my SAS file below so that you can see what I'm doing. This is the file with the monthly observations that I want to rewrite to a file that I can use when I have daily observations. I've also added two images that show you what the dataset 'msex2' looks like when I have monthly observations and what it looks like when I have daily observations. I really appreciate it that you take time to look at my problem and I appreciate your help a lot!
*****************************************************************************;
*options obs=200000;
*****************************************************************************
1. Specifying Options;
libname crsp 'C:\Users\Gebruiker\Documents\Universiteit\Jaar 4\Master Thesis\SAS Data\Datasets';
*****************************************************************************;
*** NUMBER OF PRIOR MONTHS USED TO CREATE VOLATILITY PORTFOLIOS;
%let J=12; * J can be between 3 to 12 months;
*** HOLDING PERIOD IN MONTHS AFTER PORTFOLIO CREATION;
%let K=1; * K can be between 3 to 12 months;
*** Footnote 4 page 69: 1965-1989 are the dates of portfolio holding periods;
*** BEGINING SAMPLE PERIOD;
%let begyear=1965;
*** ENDING SAMPLE PERIOD;
%let endyear=1989;
*****************************************************************************
2. Get Historical Exchange Codes and Share Codes for Common Stocks
*****************************************************************************;
* Merge historical codes with CRSP Monthly Stock File;
proc sql;
create table msex1
as select a.permno, a.date, a.ret, a.shrout, a.prc, a.shrout*a.prc as ME, b.exchcd, b.shrcd
from crsp.msfwithshrout(keep=date permno ret shrout prc) as a
left join crsp.mseall(keep=date permno exchcd shrcd) as b
on a.permno=b.permno and a.date= b.date;
quit;
* Complete the time series for exchcd & shrcd and select all common stocks;
proc sort data=msex1; by permno date; run;
data msex2;
set msex1;
by permno date;
prc = abs(prc);
ME = abs(ME);
retain lexchcd lshrcd;
if first.permno then
do;
lexchcd = exchcd ;
lshrcd = shrcd;
end;
else
do;
if missing(exchcd) then exchcd = lexchcd;
else lexchcd = exchcd;
if missing(shrcd) then shrcd = lshrcd;
else lshrcd = shrcd;
end;
* Subsample after filling missing Exchange and Share Codes;
if exchcd in (1,2,3); * NYSE, AMEX and NASDAQ securities only;
if shrcd in (10,11) and not missing(ret); * Common Stocks only;
* Additional years of lagged return for portfolio formation and holding;
if (&begyear-2)<=year(date)<=&endyear;
drop lexchcd lshrcd shrcd exchcd;
run;
********************************************************************************
3. CREATE VOLATILITY MEASURES;
********************************************************************************
*;
proc sql;
create table vol
as select distinct a.permno, a.date, std(ret) as std_ret
from msex2 (keep=permno date) as a, msex2 as b
where a.permno=b.permno and 0<=intck('month', b.date, a.date)<&J
group by a.permno, a.date
having count(b.ret)=&J;
quit; * Keep stocks with available return info in the formation period;
proc sort data=vol; by date; run;
proc rank data=vol out=vol1 group=10;
by date;
var std_ret;
ranks volr;
run;
data vol2;
set vol1(drop=std_ret);
volr=volr+1;
* VOLR is the portfolio rank variable taking values between 1 and 10:
1 - the lowest volatility group
10 - the highest volatility group;
label volr = "Volatility Portfolio";
run;
********************************************************************************
4. Assign Ranks to the Next 1 (K) Month After Portfolio Formation
********************************************************************************;
* Portfolio return are average monthly returns rebalanced monthly;
proc sql;
create table msfx2
as select distinct a.volr, a.date as form_date, a.permno, b.date, b.ret, b.shrout, b.prc, b.ME
from vol2 as a, msex2 as b
where a.permno=b.permno
and 0<intck('month',a.date,b.date)<=&K;
quit;
********************************************************************************
5. Calculate Equally-Weighted Average Monthly Returns
********************************************************************************;
proc sort data=msfx2; by date volr form_date shrout prc ME; run;
* Portfolio monthly return series;
proc means data = msfx2 noprint;
by date volr form_date shrout prc ME;
var ret;
output out = msfx3 mean=ret;
run;
* Portfolio average monthly return;
proc sort data=msfx3; by date volr;
where year(date) between &begyear and &endyear;
run;
proc means data = msfx3 noprint;
by date volr;
var ret;
output out = ewretdat mean= ewret std = ewretstd;
run;
proc sort data=ewretdat; by volr ; run;
Title "Table 1: Returns of Volatility Portfolios";
Title2 "Portfolios based on &J month lagged return and held for &K months";
proc means data=ewretdat mean std t probt;
class volr;
var ewret;
run;
********************************************************************************
*****
6. Calculate Buy-Sell Portfolio Returns
********************************************************************************
*****;
proc sort data=ewretdat; by date volr; run;
proc transpose data=ewretdat out=ewretdat2
(rename = (_1=BUY _2=PORT2 _3=PORT3 _4=PORT4 _5=PORT5
_6=PORT6 _7=PORT7 _8=PORT8 _9=PORT9 _10=SELL));
by date;
id volr;
var ewret;
run;
data ewretdat3;
set ewretdat2;
BUY_SELL=Buy-Sell;
run;
proc means data=ewretdat3 n mean std t probt;
var Sell Buy Buy_Sell;
run;
********************************************************************************
*****;
.jpg")
Catch up on SAS Innovate 2026
Nearly 200 sessions are now available on demand in the Innovate Hub.
Watch Now →Learn the difference between classical and Bayesian statistical approaches and see a few PROC examples to perform Bayesian analysis in this video.

Find more tutorials on the SAS Users YouTube channel.
SAS Training: Just a Click Away
Ready to level-up your skills? Choose your own adventure.
-
2 replies
-
05-28-2015 03:47 AM
-
3157 views
-
1 like
-
2 in conversation
-
