- Home
- /
- Programming
- /
- SAS Procedures
- /
- Re: Frequency
- RSS Feed
- Mark Topic as New
- Mark Topic as Read
- Float this Topic for Current User
- Bookmark
- Subscribe
- Mute
- Printer Friendly Page

- Mark as New
- Bookmark
- Subscribe
- Mute
- RSS Feed
- Permalink
- Report Inappropriate Content
Hello,
I am trying to get information about the number of times the code was assigned to members of the cluster.
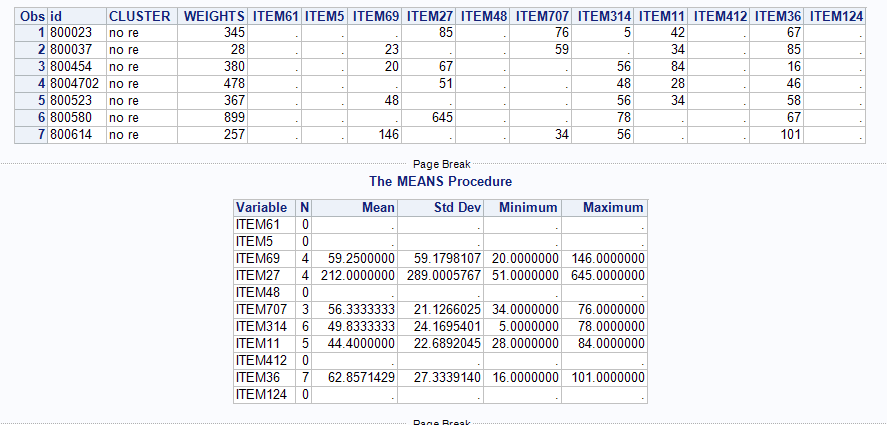
I have a cluster of population called "no re". Each observation represents a number of people with similar characteristics. The weights are shown in the column "WEIGHTS".
ITEM61--ITEM1415 show the consumption of particular foods (in grams). If people did not consume one of the items, the value is zero.
I would like to see how many times each item was assigned to the cluster, see the average amount (in grams) and percentage (based on the average) of that item in the total consumption of all items. Then delete all columns if they have '0' times of the code assigned.
SAMPLEID | CLUSTER | WEIGHTS | ITEM61 | ITEM5 | ITEM69 | ITEM27 | ITEM48 | ITEM707 | ITEM314 | ITEM11 | ITEM412 | ITEM36 | ITEM124 | ... | ... | ... | ... | ... | ... | ... | ... | ITEM1415 |
|---|---|---|---|---|---|---|---|---|---|---|---|---|---|---|---|---|---|---|---|---|---|---|
| 800023 | no re | 345 | 0 | 0 | 0 | 85 | 0 | 76 | 5 | 42 | 0 | 67 | 0 | 15 | ||||||||
| 800037 | no re | 28 | 0 | 0 | 23 | 0 | 0 | 59 | 0 | 34 | 0 | 85 | 0 | 46 | ||||||||
| 800454 | no re | 380 | 0 | 0 | 20 | 67 | 0 | 0 | 56 | 84 | 0 | 16 | 0 | 73 | ||||||||
| 8004702 | no re | 478 | 0 | 0 | 0 | 51 | 0 | 0 | 48 | 28 | 0 | 46 | 0 | 49 | ||||||||
| 800523 | no re | 367 | 0 | 0 | 48 | 0 | 0 | 0 | 56 | 34 | 0 | 58 | 0 | 57 | ||||||||
| 800580 | no re | 899 | 0 | 0 | 0 | 645 | 0 | 0 | 78 | 0 | 0 | 67 | 0 | 113 | ||||||||
| 800614 | no re | 257 | 0 | 0 | 146 | 0 | 0 | 34 | 56 | 0 | 0 | 101 | 0 | 345 | ||||||||
| .... | ... | ... | ||||||||||||||||||||
| .... | ... | ... | ||||||||||||||||||||
want to see: | ||||||||||||||||||||||
Number of times the code assigned | 0 | 0 | 4 | 4 | 0 | 3 | 6 | 5 | 0 | 7 | 0 | 7 | ||||||||||
| Mean | 0 | 0 | 59.25 | 212 | 0 | 56.33 | 49.83 | 44.4 | 0 | 62.86 | 0 | 99.71 | ||||||||||
| Min | 0 | 0 | 0 | 0 | 0 | 0 | 0 | 0 | 0 | 16 | 0 | 15 | ||||||||||
| Max | 0 | 0 | 146 | 645 | 0 | 76 | 78 | 84 | 0 | 101 | 0 | 345 |
I tried:
proc means data=have;
class CLUSTER;
var ITEM61--ITEM1415;
weight WEIGHTS;
output out=want;
run;
AND
proc freq data=have;
weight WEIGHTS;
run;
but both show _freq_ for each of the items = number of all observations in this cluster regardless if they had '0' consumption..
Could you please suggest where I am going wrong..?
Thank you very much!
Best Regards,
Anastasia

- Mark as New
- Bookmark
- Subscribe
- Mute
- RSS Feed
- Permalink
- Report Inappropriate Content
Sounds like you want the summary where 0 is set to missing. Of course MIN won't be zero in that case.

- Mark as New
- Bookmark
- Subscribe
- Mute
- RSS Feed
- Permalink
- Report Inappropriate Content
Your code indicates that you want to use the Weights variable, but your example shows expected values that aren't affected by the Weights variable. If your example is correct then you might be able to use something like:
data have;
infile cards dlm='09'x;
input SAMPLEID CLUSTER $ WEIGHTS ITEM61 ITEM5 ITEM69 ITEM27 ITEM48
ITEM707 ITEM314 ITEM11 ITEM412 ITEM36 ITEM124 ITEM1415;
cards;
800023 no re 345 0 0 0 85 0 76 5 42 0 67 0 15
800037 no re 28 0 0 23 0 0 59 0 34 0 85 0 46
800454 no re 380 0 0 20 67 0 0 56 84 0 16 0 73
8004702 no re 478 0 0 0 51 0 0 48 28 0 46 0 49
800523 no re 367 0 0 48 0 0 0 56 34 0 58 0 57
800580 no re 899 0 0 0 645 0 0 78 0 0 67 0 113
800614 no re 257 0 0 146 0 0 34 56 0 0 101 0 345
;
proc summary data=have nway;
var item61--item1415;
output out=need1 (drop=_:) min=;
run;
data need1;
format type $40.;
set need1;
type='Min';
run;
proc summary data=have nway;
var item61--item1415;
output out=need2 (drop=_:) max=;
run;
data need2;
format type $40.;
set need2;
type='Max';
run;
data test;
set have;
array items(*) item61--item1415;
do _n_=1 to dim(items);
if items(_n_) eq 0 then call missing(items(_n_));
end;
run;
proc summary data=test nway;
var item61--item1415;
output out=need3 (drop=_:) n=;
run;
data need3;
format type $40.;
set need3;
type='Number of times the code assigned';
run;
proc summary data=test nway;
var item61--item1415;
output out=need4 (drop=_:) mean=;
run;
data need4;
format type $40.;
set need4;
array items(*) item61--item1415;
do _n_=1 to dim(items);
if missing(items(_n_)) then items(_n_)=0;
end;
type='Mean';
run;
data want;
set need3 need4 need1 need2;
run;
.jpg")
Catch up on SAS Innovate 2026
Nearly 200 sessions are now available on demand in the Innovate Hub.
Watch Now →Learn the difference between classical and Bayesian statistical approaches and see a few PROC examples to perform Bayesian analysis in this video.

Find more tutorials on the SAS Users YouTube channel.
SAS Training: Just a Click Away
Ready to level-up your skills? Choose your own adventure.
-
2 replies
-
02-26-2015 10:32 AM
-
2354 views
-
0 likes
-
3 in conversation
-
